Tool Search: Consolidated Report Card
Every year on the first business day in October, a snapshot of student enrollment data in the Bureau of Indian Education (BIE) is collected to satisfy Title 14 of the Bureau of Education Code funding requirements. This count does not include students who enrolled after October 1st and is independent of the ISEP count that occurs on the last Friday of October.
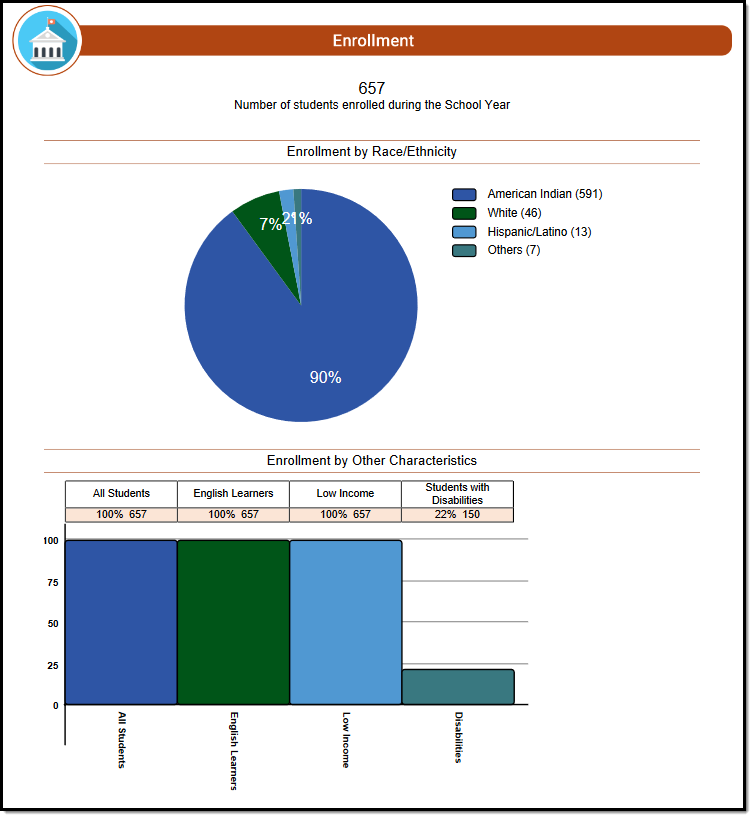 Enrollment Report - Race/Ethnicity and Other Characteristics
 Enrollment Report

Enrollment Logic
This section of the BIE Consolidated Report Card & Individual School Report Card uses student data records stored on the BIE Attendance Data Mart's certification table.
Refer to the BIE Attendance Data Mart and Data Mart Workflow articles for more information about the data marts, their data tables, and the underlying logic.
Report calculation used:
For each section, an overall percentage is displayed. This percentage is further broken down into demographic subgroups to which students may belong. For each percentage displayed, the following calculation is used:
Individual School Calculation:
(Population of students in subgroup / Population of 'All Students')*100
BIE Calculation:
(Population of students in subgroup across all BIE schools / Population of 'All Students' across all BIE schools)*100
Enrollment Field Descriptions
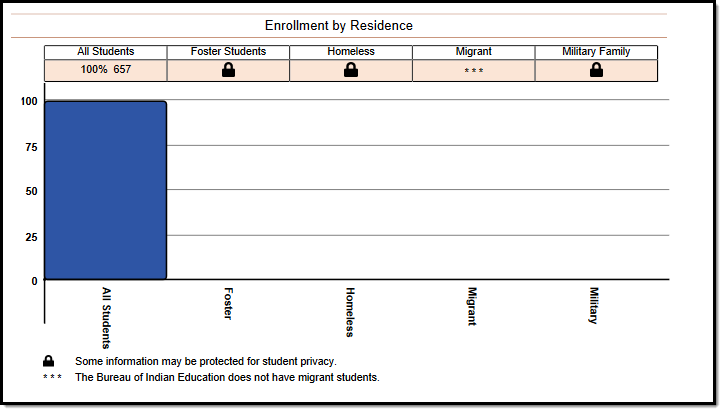
If a subgroup has 10 or fewer students, it will display a lock icon to protect student privacy and prevent student identification.
Data reported for the Enrollment section of the BIE Consolidated Report Card & Individual School Report Card is collected directly from the BIE Attendance Data Mart. Additional information about each of the fields included in this report can be found in the BIE Attendance Data Mart Reported Fields section of the BIE Attendance Data Mart article.
| Field | Description | Location |
|---|---|---|
| Enrollment by Race/Ethnicity | Reports the total percentage of students from the attendance data mart who have the countDate column set by Race/Ethnicity. Data mart logic used: Reports the student's Federal Designation race/ethnicity of their current identity. | Data Mart: BIE Attendance Data Mart Data Table: BIEDMAttendanceCertification Data Mart Element: Race/Ethnicity |
| Enrollment by Other Characteristics Reports the total percentage of students in the attendance data mart whose countDate column is set to Other Characteristics. | ||
| All Students | Calculated. Students must have an enrollment to a BIE school a NASIS ID to be included. | Data Mart: BIE Attendance Data Mart Data Table: BIEDMAttendanceCertification Data Mart Element: NASIS ID (total) |
| English Learners | Calculated to report as a percentage. Data mart logic used: Refer to the English Learner description of the BIE Attendance Data Mart | Data Mart: BIE Attendance Data Mart Data Table: BIEDMAttendanceCertification Data Mart Element: English Learner |
| Low Income | Calculated to report as a percentage. Data mart logic used: Status of 'Y' always reports. | Data Mart: BIE Attendance Data Mart Data Table: BIEDMAttendanceCertification Data Mart Element: Economic Disadvantaged |
| Students with Disabilities | Calculated to report as a percentage. Data mart logic used: Identified as student's primary disability from their latest plan of the selected school year. Only Locked BIE IEP's and BIE IEP with Transition plans report. | Data Mart: BIE Attendance Data Mart Data Table: BIEDMAttendanceCertification Data Mart Element: Primary Disability |
| Enrollment by Residence Reports the total percentage of students in the attendance data mart with the countDate column set by Residence. | ||
| All Students | Calculated to report as a percentage. Students must be enrolled in a BIE school and have a NASIS ID to be included. | Data Mart: BIE Attendance Data Mart Data Table: BIEDMAttendanceCertification Data Mart Element: NASIS ID (total) |
| Foster Students | Calculated to report as a percentage. Data mart logic used: Identified as the student's BIE foster care status for the selected school year. | Data Mart: BIE Attendance Data Mart Data Table: BIEDMAttendanceCertification Element: fosterCare |
| Homeless | Calculated to report as a percentage. Data mart logic used: Identified as the student's homeless status of the Homeless Nighttime Residence field from the last year of their enrollment within the cohort. | Data Mart: BIE Attendance Data Mart Data Table: BIEDMAttendanceCertification Element: homeless |
| Migrant | Does not calculate. The BIE does not have migrant students. | Data Mart: BIE Attendance Data Mart Data Table: BIEDMAttendanceCertification Element: migrant |
| Military Family | Calculated to report as a percentage. Data mart logic used: Identified as the status of the student's relationship to the military for the selected school year. | Data Mart: BIE Attendance Data Mart Data Table: BIEDMAttendanceCertification Element: militaryConnectionStatus |
