Tool Search: Section Summary Report
The Section Summary Report displays student scores and any score flags for the selected assignments. This report generates in two parts. A separate page reports for each Task and Standard, which also includes a list of assignments. The final page(s) of the report includes a list of all Tasks and Standards selected and each student's posted Percent and Final Grade (based on the Grading Task Grid options selected).
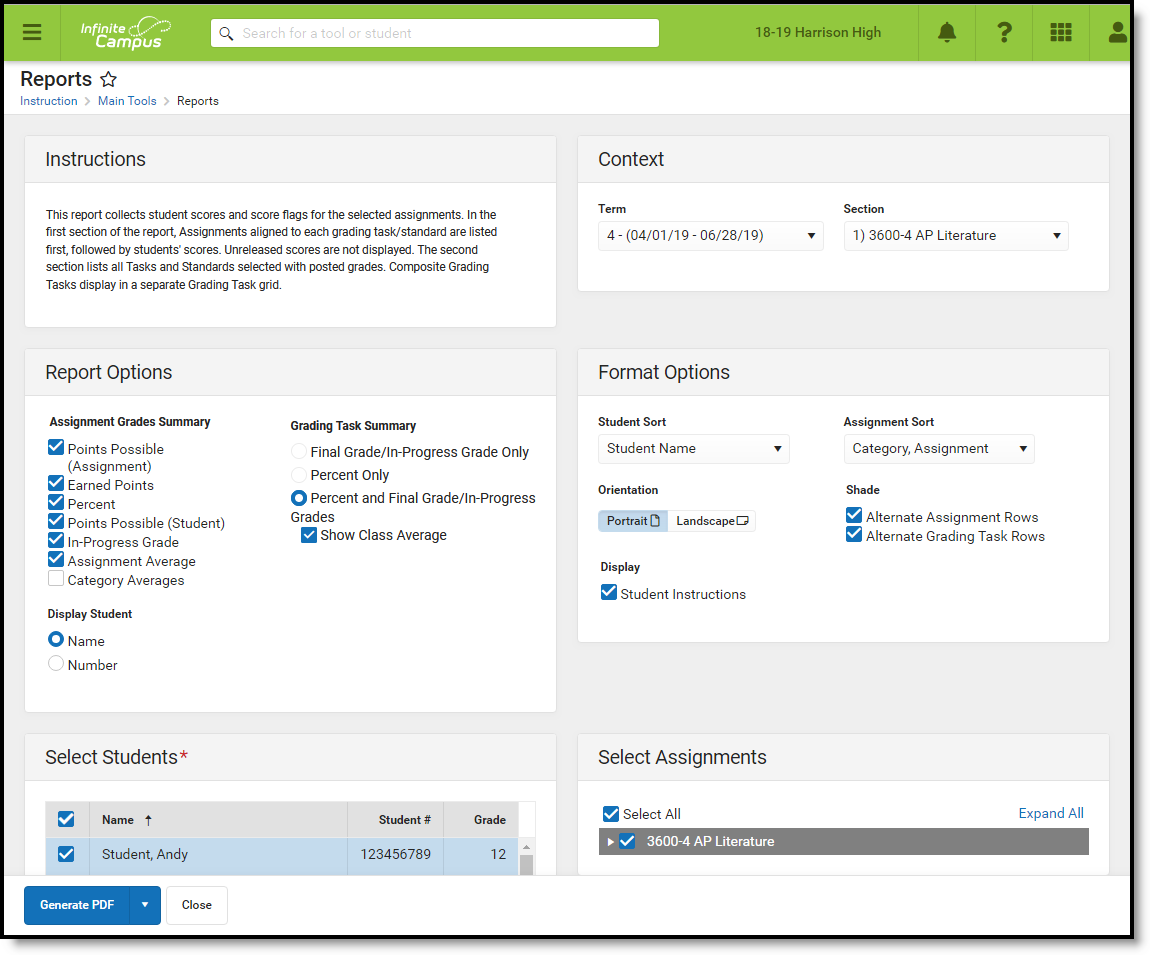 Section Summary Report Editor Options
Information included on the Section Summary reports from your Grade Book.
Each Task or Standard aligned to the section selected in the Campus toolbar reports on its own page. Consider what options to select and how many assignments to include in the report, as these decisions affect the layout and appearance of the report.
Generate the Report
- In Context, select the Term and Section for which you want to view assignments. Select multiple sections if desired. The Report Options and Student list will include data from all selected sections.
- Next, in Report Options, select which data should be included in the report.
- The Assignment Grades Summary options include what score and grade data should be included for the assignments and tasks selected. Each options is described in the table below.
- In Display Student, indicate if the report should identify students by Name or Number.
- In Grading Task Summary, indicate if grades should be reported with the Final Grade, Percent, or Both and indicate if the Class Average should be included.
- In Format Options, indicate how the report should be laid out.
- Student Sort order
- Assignment Sort order
- Orientation
- Shading
- Indicate if Student Instructions should be included (if using Campus Learning).
- Finally, review the selected Students and Assignments and modify as desired. Students can be filtered by Student Group. should be included in the report. Assignments display in a hierarchy under their aligned Task/Standard and Category. More information about these options is provided below.
- Click Generate PDF to view the report in PDF format or click the arrow button next to Generate to select a different format.
The report generates with a page for each Task and Standard selected. First, categories and assignments in that task or standard are listed. Then, the student grid lists all selected students and their scores earned.
The final page(s) of the report includes a list of all Tasks and Standards selected and each student's Percent and Final Grade where grades have been posted. Grades are posted using the Grade Book or Grading By Task or Student.
Tell Me More
Learn more about specific options in the report below.
Report Options
Assignment Grades Summary
|
Display Student
Grading Task Summary
|
Format Options
|
Student Sort Sorts by the option selected, regardless of whether student names or numbers are displayed. Options are:
|
Assignment Sort
Sorts assignment listed for each Task/Standard by the option selected. Options are:
|
| Orientation: Orient the report in Portrait or Landscape format. Portrait mode can be helpful for sections with many students, whereas Landscape mode is useful in sections with many assignments. | |
| Shade: Shades alternate rows in the Assignment grid and/or the Grading Task grid for easier reading. | |
| Student Instruction: Includes the Summary entered on the assignment. This information can only be added if the teacher has Campus Learning. | |
Student and Assignment Selection
Mark the checkbox next to a student's name to include that student in the report. All active students are marked by default. Use the Toggle Students option to mass mark or unmark all students. Inactive students display in red text.
Mark the checkbox next to a Task and Standard, Category, or Assignment to include students' scores for that item in the report. Use the Select All option to mass mark or unmark all items. Marking a Task, Standard, or Category automatically marks all assignments within it, but individual assignments can be marked or unmarked as desired. All items are selected by default. Assignments that are not included in grade calculation or in Categories that are excluded from calculation are marked as .
.
Note that Category Weights display in the assignments list if they have been entered for your Categories. However, Category Weights only display in the report if "Weight Categories" has been marked in the Grade Calculation Options.
Report Example
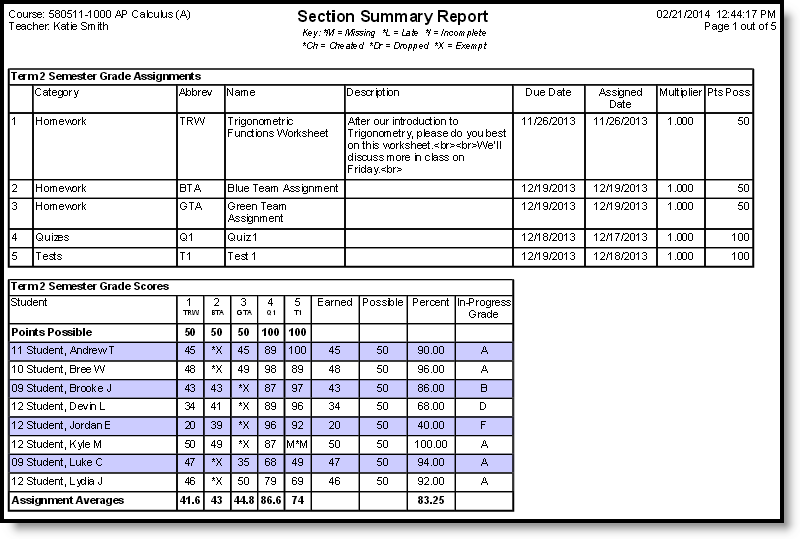
Section Summary Report Example
