Campus Grade Book allows teachers to enter assignment scores and track student progress. This Study Guide will build off the basics of Grade Book and provide instruction on advanced Grade Book setup. These features include filtering student progress, analyzing student performance, posting student grades, and generating Campus Instruction reports.
Grade Book Review
Review Campus Grade Book
The Grade Book allows teachers to easily create assignments, enter scores, and track student progress. This document and video contain overview information about Campus Grade Book. If you are looking for a more basic overview of Campus Grade Book, please click here.
This article collects all of the articles available about the Campus Instruction Grade Book:
Settings Menu
- Grade Book Setup
- Grade Book Tools
- Other
- Preferences
Articles about Assignments
Click Library to view the Curriculum Library where you can add curriculum to your section that other teachers have shared. Click List to open the Curriculum List for this section.
Scoring and Score Analysis
The Grade Book includes a variety of tools designed to help teachers view and analyze their students' data in different ways.
- Options such as filtering and color-coding change the visual display of the Grade Book to highlight patterns in student performance and help teachers drill into specific problem areas.
- Other options display score data in a new way, such as sparkline graphs and box and whisker diagrams. Some analysis tools differ based on whether you are viewing a Grading Task that uses traditional scoring logic or a standards-based approach scored with rubrics.
- Finally, the Grade Totals section provides basic calculations based on student performance. These sections also differ based on whether you're scoring Tasks or Standards.
Filtering and Sorting
Posting Grades
Advanced Grade Book Setup and Filtering
Filtering and Sorting the Grade Book
Filtering options determine which students and/or assignments will display in the Grade Book. Sorting determines the order in which assignments appear.
Location: Grade Book > Sort button, Filter button
Filtering options determine which students and/or assignments display in the Grade Book.
Sorting options change the order in which assignments display in the Grade Book. Additionally, each column in the Grade Book has double arrows in the header, which can be used to sort the Grade Book by that column (alphabetically by student name or numerically by score or grade).
Sorting Assignments
Open the Sort window to sort how assignments display horizontally in the Grade Book. These options are saved with the Grade Book and apply each time you open or reload it.
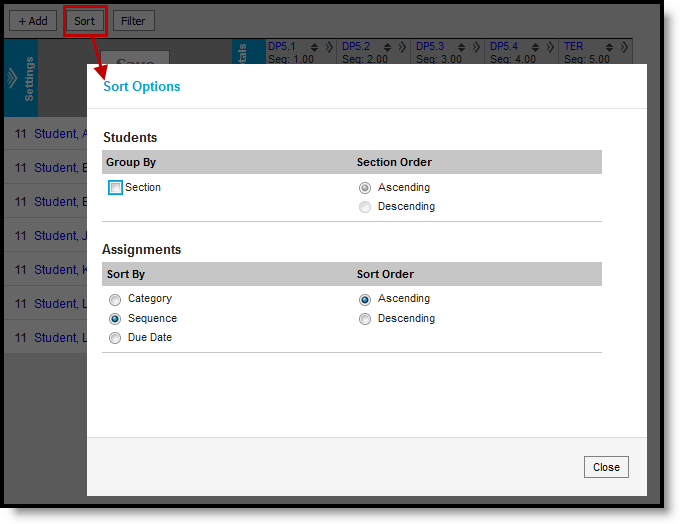
Grade Book Sorting Window
The option to sort Students by Section applies to Section Groups. If a group is selected, unmarking Section sorts students alphabetically without grouping them by section (Ascending or Descending).
For assignments, the Sort By option determines how assignments are grouped in the Grade Book, by Category (alphabetically, then by sequence), Sequence, or Due Date.
The Sort Order option determines the order of assignments:
- Category: If categories are sequenced, assignments are sorted by category sequence, then assignment sequence, then due date, then assignment name. If categories are not sequenced, assignments are sorted alphabetically by category name, then assignment sequence, then assignment name, then due date. Ascending sorts categories alphabetically beginning with A or numerically by sequence beginning with the lowest number. Descending sorts categories reverse alphabetically or numerically by sequence beginning with the highest number.
- Sequence: Ascending sorts lowest sequence to highest. Descending sorts highest sequence to lowest.
- Date: Ascending sorts earliest due date to latest. Descending sorts latest due date to earliest.
Past the midway point of the term, it may be useful to reverse the order in which assignments appear.
Sorting Students
Click the pair of arrows that appear in many column headers in the Grade Book to sort students by the values in that column.
- Click once to sort students ascending by column value with the highest value at the top.
- Click twice to sort students descending by column value with the lowest value at the top.
- Click three times to return to sort alphabetically by student name.
You can also sort students alphabetically using the arrows at the top of the Students column.

Sorting Students by Score, Grade, or Proficiency Estimate
Filtering By Students and Assignments
Open the Filter window to filter the Students and Assignments that display in the Grade Book. With the exception of the Settings > Filter Defaults, these options are reset each time you reopen or reload the Grade Book.
When filters are set, a blue dot appears in the Filter button. In the filter window, counts display next to each option. These counts are dynamic based on the options selected.
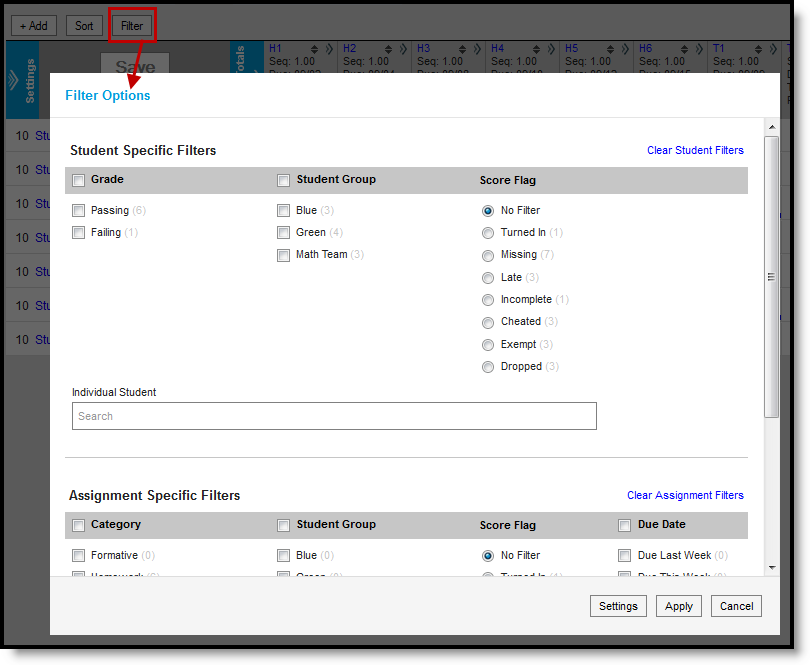 Click Filter to view filtering options.
The following filter options are available:
Student Filters
Teachers have the option of posting grades when a Student Group or Individual Student is selected.
Filter | Students Shown |
|---|---|
Grade | Shows only students who have a Passing or Failing grade in the section. This filter is based on In Progress Grade and the Grading Scale selected in the Grade Calc Options. |
| Student Group | Shows only students who are in the selected group(s). |
| Score Flag | Shows only students who have at least one assignment marked with the selected score flag. All assignments (rather than only flagged ones) display, unless the corresponding score flag is marked in the assignment filters. |
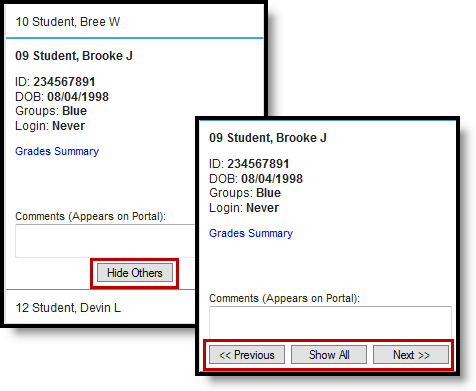
| Individual Student | Search for an individual student to exclude all others from view. This option is helpful when showing a student only their scores during a meeting or parent-teacher conference. This option mirrors the effect of expanding a student in the Grade Book and clicking "Hide Others."
|
Assignment Filters
Filter | Students Shown |
|---|---|
Category | Show only assignments in the selected category(s). |
| Student Group | Shows only assignments assigned to the selected group(s). |
| Score Flag | Shows only assignments that have the selected score flag marked for at least one student. All students (rather than only flagged ones) display, unless the corresponding score flag is marked in the student filters. |
| Due Date | Shows only assignments due during the calendar week(s) selected. These options can be set as the default Grade Book view that apply automatically when you open or reload the Grade Book. |
| Individual Assignment | Search for an individual assignment to only view that one. This option is helpful to score a specific assignment among many. |
Filter Defaults
Location: Grade Book > click Filter > Settings; Grade Book > expand Settings menu > Filter Defaults
The three Due Date filters can be set as default filters for the Grade Book: Due Last Week, Due This Week, and Due Next Week. Set defaults from the Filter window or the Grade Book Settings menu.
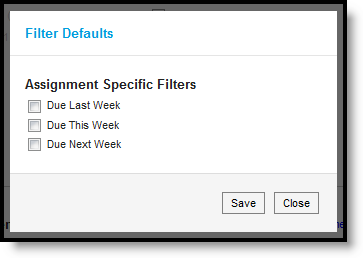
Filter Default Options
When set as default, these filters apply automatically when you open or reload the Grade Book.
Filtering Tips
- Within a column in the filter window, OR logic applies. For example, select two student groups in the student filters to view students in either group.
- Across columns in the filter window, AND logic applies. For example, select a student group filter and the Missing score flag in the assignment filter to view assignments assigned to the selected group that have at least one score flagged as missing.
- Combine student and assignment filters to further focus the Grade Book. For example, marking both Missing score flag options filters the Grade Book so that only students who are missing at least one assignment and assignments that have at least one score flagged as missing.
- With the exception of Filter Defaults, all filters are cleared when you reopen or reload the Grade Book.
Grade Book Settings can be used to configure assignment filter defaults. In this simulation, a teacher would like to limit the default amount of assignments that display.
Manage Sections Groups
The Section Groups tool allows teachers to group similar course sections together to be accessed simultaneously in the Grade Book. Groups make scoring assignments easier by combining matching assignments into shared columns in the Grade Book. Section Groups are an optional Grade Book feature for teachers.
Location: Grade Book > expand Settings menu > Section Groups
Section Groups allow a teacher to group similar sections together in a single grade book view. Groups make scoring assignments easier by combining matching assignments into shared columns in the grade book.
Selected groups apply to the grade book view only. However, all calculations and graphs (for Traditional Grading and Standards-Based) presented in the grade book view do cover all students in a section group.
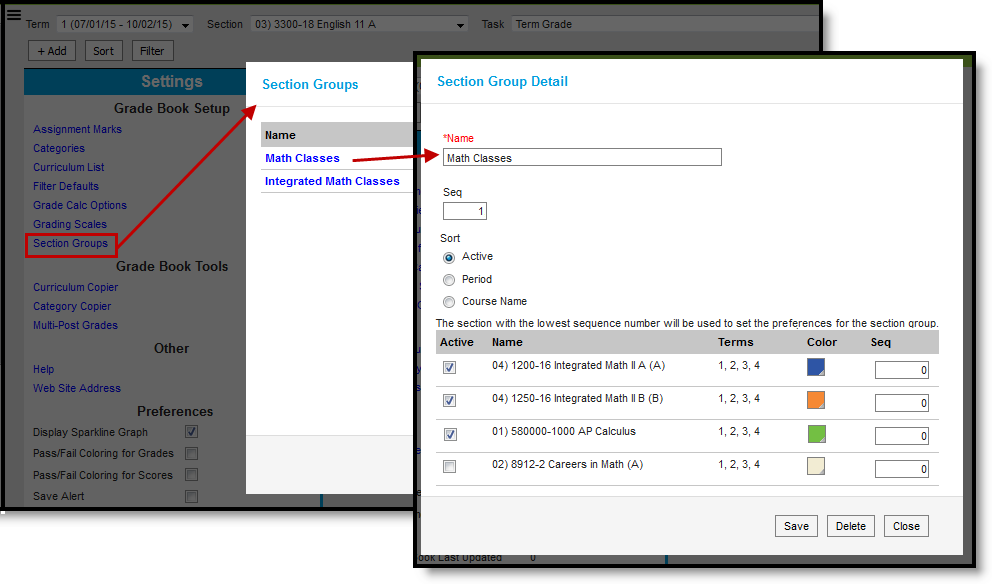 Section Groups in the Grade Book.
Access to section groups requires tool rights to the Grade Book.
When viewing the grade book for a section group, some options are not available, including some tools in the Settings menu.
Creating Section Groups
- Click Section Groups from the Settings menu of the Grade Book.
- Click Add to create a new group.
- Enter a Name for the group.
- Enter a Seq(uence) for the group.
- Select a Sort option to sort the section list by Active sections (those marked to be included in the group), by Period, or alphabetically by Course Name.
- Mark the Active checkbox next to sections to include in the group. The Terms in which each section meets are provided.
- Select a Color for each section, which displays as a small bar next to each student's name.
- Enter a Seq(uence) to order the sections horizontally in the Grade Book.
- Click Save to create the group.
Viewing and Scoring a Section Group
Section groups are selected in the Section dropdown at the top of the grade book.
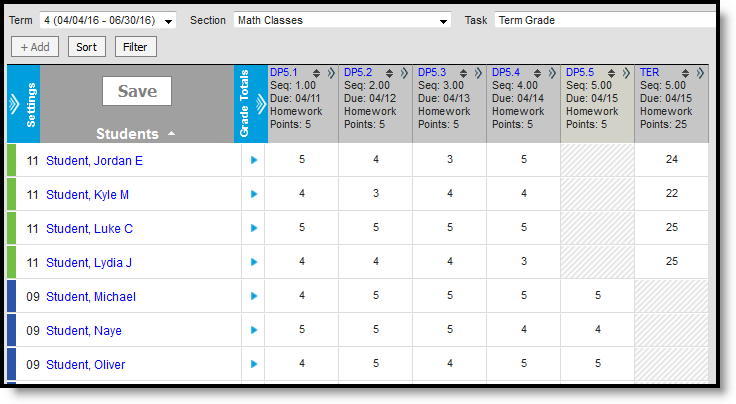 Example of a Section Groups
Students are listed based on the sequence of each section within the group and whether Section is marked in the Sort options. Unmarking Section in the Sort options sorts students alphabetically without grouping them by section. Other filtering and sorting options are also available.
Assignments are combined if they match in Name, Sequence, Due Date, Category, and Points. Columns for assignments that don't match across sections show with shaded cells for sections that do not include the assignment. Note that assignments are combined only in this grade book view; the individual assignment records for each section still exist.
In the example above, both sections have a matching DP assignment each day, except for the last day when the assignments differ.
Matching Categories are also combined. In Progress columns calculate based on the Grade Calc Options selected for each individual section. Manually Posting Grades functions as it does for an individual section.
Save
Save
Save
Save
Save
Save
The Section Groups tool allows teachers to group sections together to view them simultaneously in the Grade Book. This video demonstrates how to create and manage section groups.
Using Student Groups
Teachers can use the Student Groups tool to sort students into smaller learning groups within a course section. Teachers can then assign an assignment to only students in a specific group. An assignment aligned to a Student Group will only count towards students in the group. All other students will be exempt from the assignment.
Tool Search: Student Groups
Use Student Groups to sort students into smaller learning groups within a section. You can then assign assignments to only the students in a specific group. See the Use Student Groups article for more information about how to use student groups in grading.
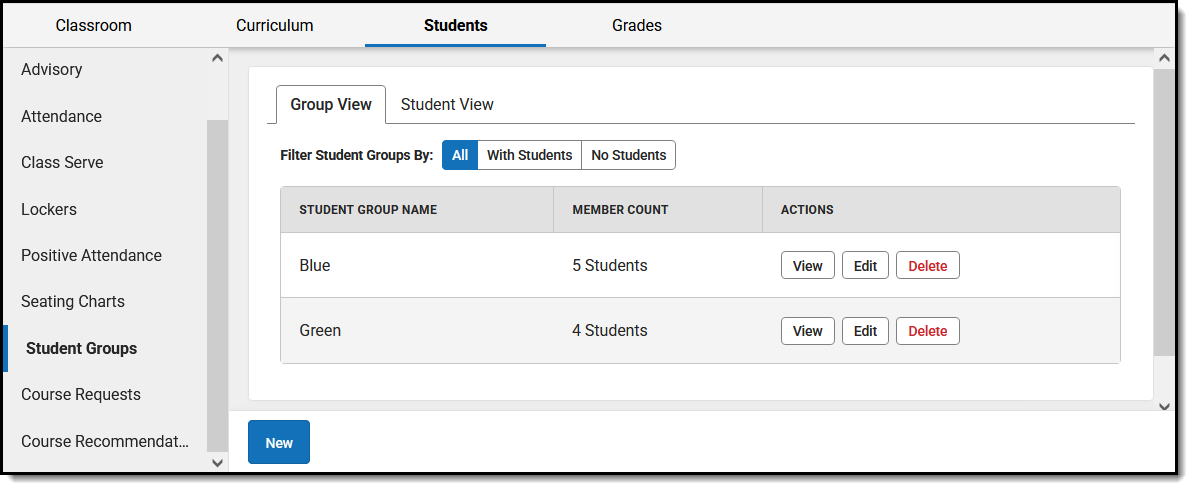 Use Student Groups to create subsets of students in a section.
 See the Instruction Tool Rights article for information on available tool rights.
'Views' in the Student Groups Tool
The Student Groups tool has two different views:
- The Group View lists groups for that section with the number of students. Filter this view to show groups that have students and those that don't.
- The Student View lists students in the section with their group memberships. Filter this view to show students who are assigned to a group and those that are not.
Create a Student Group
You can create groups with any combination of students in a group.
- From the Student Groups tool, select the Section you want to create a group for at the top of the screen.
- Click New to open a new group.
- Enter a Name for the group, which appears in assignments and the Grade Book.
- Groups are marked as Active by default. Unmark this checkbox to exclude the group from appearing in assignments and the Grade Book. Inactive groups display in red text in the groups list.
- From the Student Roster list, click Add next to any student who should be in the group. Those names move to the Group Members list at the right.
- Sort Students By Name or by Grade level.
- To display other groups each student is assigned to, toggle Show Other Groups to On.
- Click the student's name to view basic demographic data and contact information for the student.
- If your school is using Blended Learning, an icon indicating each student's blended learning group displays next to their name, based on the Term selected.
- To move students out of the Group Members list, click Remove next to the name.
- Click Save to create the group.
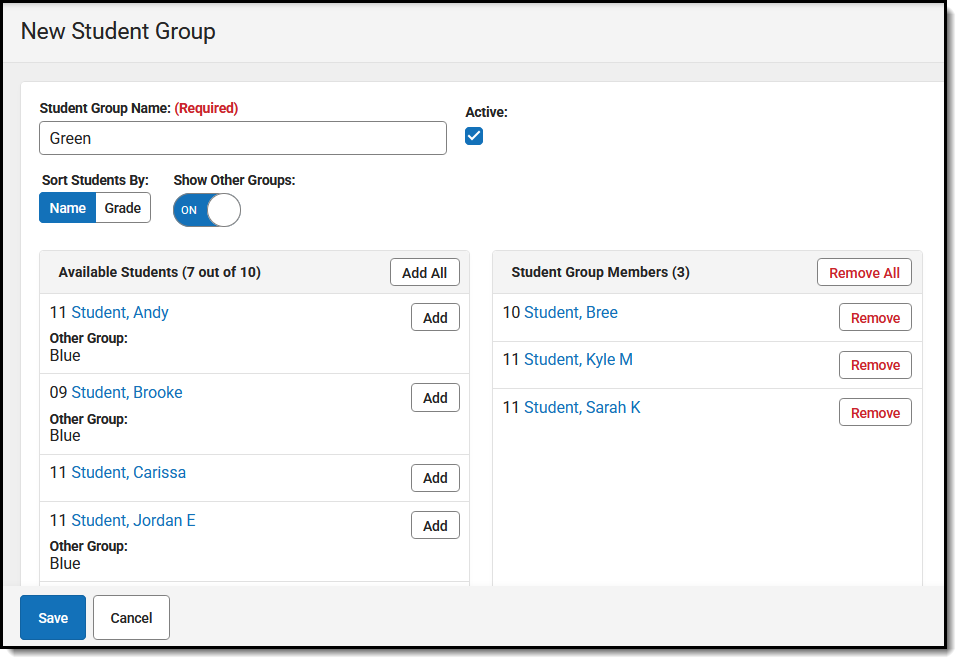 Click Add to move students to the Group Members list.
 Review and Modify Groups
To see the list of students in a group, click the Group View and then View in the Actions column. There are also options to Edit and Delete groups.
Teachers can use Student Groups to sort students into smaller learning groups within their course section. In this video, you will learn how to create student groups, so that assignments can be assigned only to students belonging to a specific group.
Previous Versions
Student Groups - Video [.2140 - .2523]
Copy Student Scores
Teachers can use the Score Copier tool to accept scores for student who have transferred into one of their course sections. Assignment scores that the transfer student received in a previous section can be copied to unscored assignments in the new section. For instance, teachers can use the Score Copier tool to copy student scores when a student transfers from their first period section into their fifth period section.
Location: Grade Book > expand Settings menu > Score Copier
The Score Copier allows teachers to receive scores for students who have transferred into one of their sections. Assignment scores that the student received in the previous section can be copied to unscored assignments in the new section.
Teachers can also generate the Student Summary report for the student's previous section to review assignments and scores.
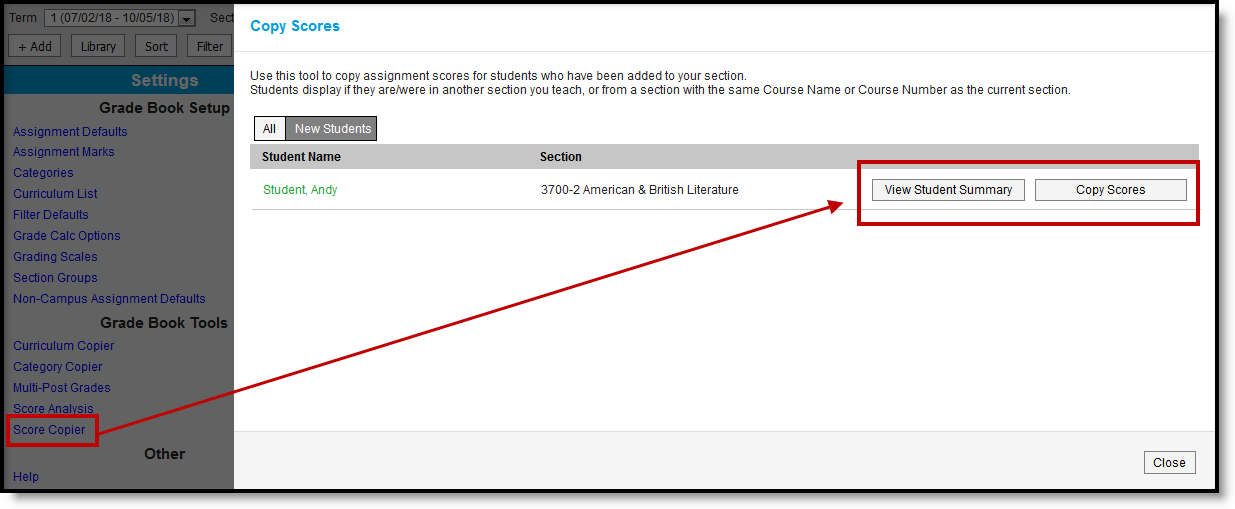
Use the Score Copier to receive scores for students who have transferred into your section.
The Score Copier tool right in Additional Access Rights > Instruction Tools is required to use this tool.
See the Instruction Tool Rights article for more information.
Which Students Display
Students who have been added to the section currently selected in the Grade Book are displayed. Additionally, one of the following conditions must be met:
- You teach the student in both current section and another section. For example, the student moved English 10 to AP English, as in Andy's Example.
- The current section and the student's other section have the same Course Name or Course Number. For example, a student moved from another teacher's 2nd period Geography class into your 3rd period Geography class.
Click ![]() to only view students who were recently added to your section and whose names display in green text. This preference is set by your district.
to only view students who were recently added to your section and whose names display in green text. This preference is set by your district.
Student Summary
Click ![]() to view the Student Summary report for the student's previous section.
to view the Student Summary report for the student's previous section.
The report shows any tasks/standards with scored assignments in the Grade Summary and any assignments in the Assignment Detail.
Another use of this report is to view the any posted and in-progress grades for the student, to get an idea of how to student was doing in the course overall.
Copy Scores
Click ![]() to view a list of scored assignments in the previous section (Source). Click an assignment name to view a summary of the assignment, including Teacher Notes, Student Instructions, and Content. The Task/Standard the assignment is aligned to and the student's score as a percentage display. When scores are copied, students receive that percentage of possible points. For example, if a student received 9/10 points on the source assignment and the destination assignment is worth 20 points, the student receives 18 points.
to view a list of scored assignments in the previous section (Source). Click an assignment name to view a summary of the assignment, including Teacher Notes, Student Instructions, and Content. The Task/Standard the assignment is aligned to and the student's score as a percentage display. When scores are copied, students receive that percentage of possible points. For example, if a student received 9/10 points on the source assignment and the destination assignment is worth 20 points, the student receives 18 points.
The Destination Assignment column shows the assignments that will receive copied assignment scores upon Save.
- Assignments that match display in the Destination column automatically. Matching assignments are those that are aligned to both the source and destination sections in the Scheduling Alignment area of the assignment.
- Other assignment scores can be copied if the task/standard alignment is the same and if the destination assignment does not have a score. Click
 to view a list of destination assignments whose scores can be coped.
Click  to copy scores into the grade book. Note that score flags do not copy with scores, since teachers may define flags differently. Return to the Score Copier at any point to view assignments and copy scores.
A Comment is added to the destination assignment indicating the assignment and section the score was copied from.
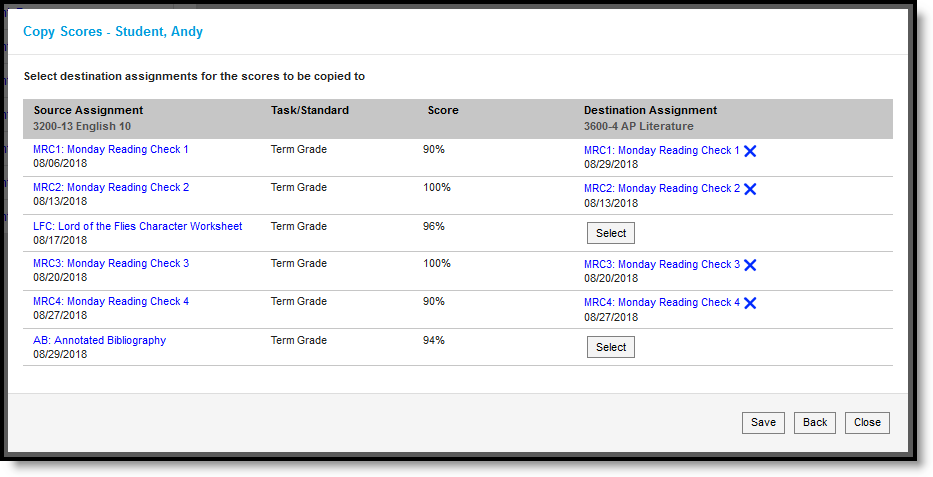
Copy scores for source assignments to destination assignments.
Andy's Example
The images above provide an example of Andy transferring from a section of English 10 to a section of AP Literature. I teach both sections, which is why Andy displays in the Score Copier.
I have a weekly Monday Reading Check in all of my English classes, graded using assignments aligned to all of my sections in the Scheduling Alignment. Because those assignments match, those scores copied automatically.
The Annotated Bibliography assignment from English 10 is similar to an assignment in AP Literature, so I'll copy that score:
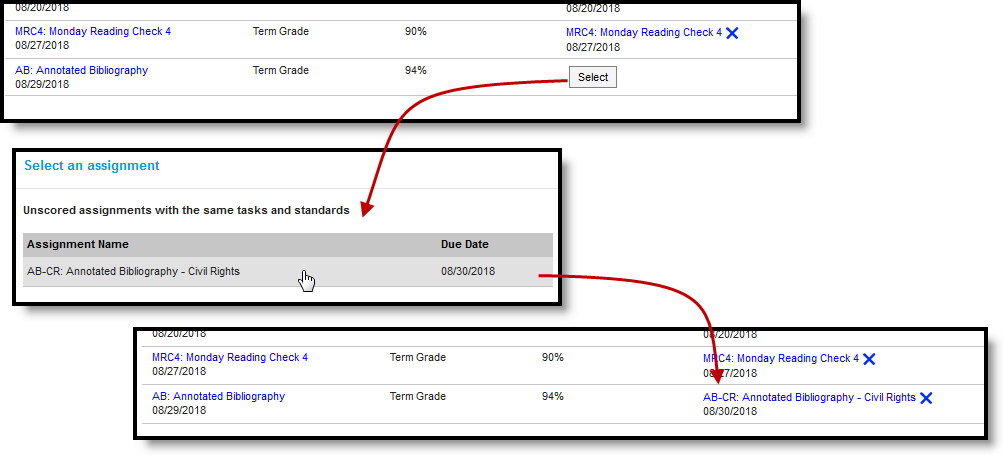
Select an assignment to copy the score.
When I save, scores show in the grade book for the selected destination assignments.
The Score Copier allows teachers to copy assignment scores from one course section to another when a student's schedule changes. In this video, you will learn how to copy scores using the Score Copier.
The Score Copier tool allows teachers to accept assignment scores for students who have transferred into one of their course sections. In this lesson, a teacher needs to transfer scores for one of his students from one course section to another.
Analyze Student Performance
Scoring Analysis
Scoring analysis options in the Grade Book differ based on whether the task you're scoring uses Points/Marks or Rubrics. Standards can be scored with any of the three options, but grading tasks can only be scored with Points or Marks. The below documents describe the scoring analysis options for Traditional Grading and Standards-Based Grading.
Tool Search: Grade Book
The scoring analysis options available in the Grade Book differ based on whether the task you're scoring uses Points/Marks or Rubrics.
You can score standards with any of the three options, but grading tasks can only be scored with Points or Marks.
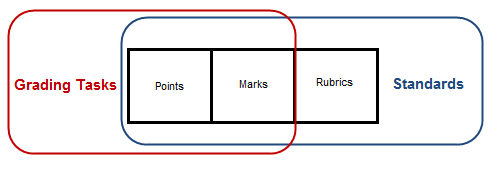
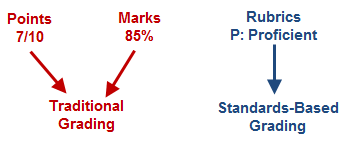
Points and Marks express student performance as a number, such as 7/10 points or 85%. Rubrics describe the quality of student performance, such as Developing or Proficient.
Points and Marks represent "traditional grading," whereas scoring with rubrics applies a "standards-based" approach.
Options Available for Traditional Grading
Grading Tasks are scored using Points or Marks, which means that grades are calculated based on the points or percentage earned by the student on each assignment and the subsequent weight of assignments and categories. Standards can be scored using Points or Marks as well.
All of the options described in this article are dependent on establishing Grade Calc Options to calculate In Progress Grades.
The following sections describe:
- Sparkline Graphs, which summarize individual student performance.
- Box and Whisker Diagrams, which display student performance in relation to other students in the section.
- The Calculation Summary that displays for an assignment or category.
- The Grade Totals section that includes In Progress calculations and posted grades.
Sparkline Graphs
If you've set the Sparkline Graph preference, a blue sparkline graph displays next to the student's name. This graph condenses all scores into a compact graph that shows the patterns in the student's overall performance over time. This graph is always displayed chronologically, regardless of assignment sort options.
Sparkline graphs calculate based on the percentage of a score, rather than by the numeric score value. Therefore, a 6 our of 10 and a 60 out of 100 would both calculate as 60%.
Hover over the sparkline graph to view a tool tip indicating the number of scores represented in the graph.

Sparkline Graph Example
In this example, Claire's performance steadily improves over four assignments. The line is created by connecting scores to show progress over time.
Box and Whisker Diagrams
Click on a student's name or use the key command ALT S to expand the student section and view the box and whisker diagram for each assignment, as well as the Categories and In Progress section of the Grade Totals. These diagrams display student performance in relation to other students in the section, rather than points possible.
To build these diagrams, the Grade Book divides a class's scores on an assignment into quarters, called quartiles. The center line of the diagram represents the median score, with half of the students scores falling above and half below. The middle 50% of scores form the box, while the top and bottom 25% of scores form the whiskers. The current student's score is represented by a yellow dot. Since lines are based on averages rather than raw scores, student scores that are outliers, or far from the median score (average), can appear outside the diagram.
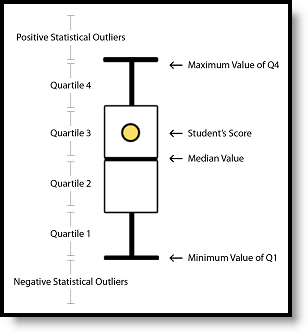
A Box and Whisker Diagram
In the Grade Book, a score scale appears along the left side indicating where scores fall by percentage. The green line represents a passing score. Statistical outliers, or scores far from the median that tend to skew calculations, are indicated with an x for other students.
Box and Whisker Examples
The following examples explain two specific Box and Whisker plots. In these examples, there are 12 students in the class, which is three students per quartile. All assignments are out of 100 points.
Student is in the Fourth Quartile
In this example, the student is within the top quarter of the class.

The student scores that produced this diagram are as follows (example student's score in bold):
- Fourth Quartile (top quarter, upper whisker) - 100, 95, 90 (average: 95)
- Third Quartile (lower-top quarter, top half of box) - 80, 75, 70 (average: 75)
- Second Quartile (upper-bottom quarter, lower half of box) - 60, 55, 50 (average: 55)
- First Quartile (bottom quarter, lower whisker) - 40, 35, 30 (average: 45)
Student is a Low Outlier
In this example, the student received a score that is significantly lower than the rest of the class, called an outlier.

The student scores that produced this diagram are as follows (example student's score in bold):
- Fourth Quartile (top quarter, upper whisker) - 100, 100, 100 (average: 100)
- Third Quartile (lower-top quarter, top half of box) - 100, 100, 100 (average: 100) Note: Identical first and second quartiles explain the non-existent top half of the diagram.
- Second Quartile (upper-bottom quarter, lower half of box) - 100, 98, 88 (average: 95.3)
- First Quartile (bottom quarter, lower whisker) - 88, 80, 10 (average: 59.3)
Calculation Summary
Hover over an assignment header to view the calculation summary tool tip, which provides basic calculations describing student performance across the assignment. These calculations include all students, regardless of any filters selected.
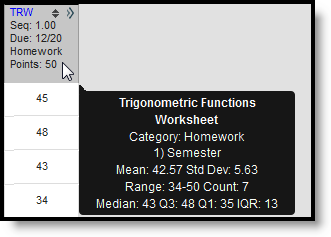
Calculation Summary for the Section in this Assignment
The calculations for an assignment scored with Assignment Marks or Points are determined as shown in the following table. Assignments that are not scored are not included in calculations.
Field | Description |
|---|---|
Mean | The average score. Calculated by adding all student scores together and dividing by the number of scores. |
Std Dev | Standard Deviation - the variation in scores based on the mean. A low standard deviation indicates that scores are grouped fairly close together, that students scored similarly on the assignment. A high standard deviation indicates that scores vary more greatly, that students did not score similarly on the assignment. |
Range | The range of the lowest score to the highest score. Displays as the lowest score - highest score (total scores). |
Count | The total number of scores entered for the assignment. |
Median | The middle score, half way between the highest and lowest scores. |
Q3 | The top score of Quartile 3, the 75th percentile. Halfway between the highest score and the median. |
Q1 | The top score of Quartile 1, the 25th percentile. Halfway between the lowest score and the median. |
IQR | Interquartile Range - the difference between Q1 and Q3. Like standard deviation, this value indicates the degree of variance across student scores. |
Points and Marks-Based Grade Totals
The Grade Totals include three sections, Posted Grades, In Progress Grades and Categories. In Progress values calculate automatically based on scores entered and cannot be directly modified. Posted grades appear on the student's Grades tab. Grades in the Posted column can be modified as desired by the teacher when the grading window is open; updated grades post upon save.
In Progress grades are only available if the Grade Calc Options are established. There, you have the option of indicating if the entered Weight for Categories should be honored and if the In Progress grade should calculate based on the raw score entered or the percent earned. Grades can only be posted if the grading window is open for the Grading Task.
Use ALT L to expand and collapse this area.
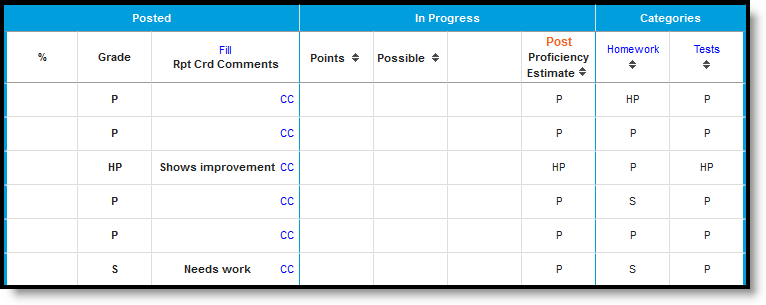
Grade Totals when using Mode of 3
In Progress grades are available for students to view on the Portal. Posting Grades is the action of publishing grades to the transcript.
Categories
A column displays for each Category in the Term and Task selected. A percentage calculates for each student based on assignments aligned to each category.
Categories marked as Exclude still have a percentage calculated but are not included in the In Progress calculations. Excluded categories appear with an asterisk.
The percentage calculated for each Category is affected by the following settings:
- Whether a Multiplier is entered for a Scoring Alignment. This value will only affect the Category percentage if the Grade Calc Option to Use score's % value is not set.
- Whether the Grade Calc Option to Use score's % value is set. For example, two assignments are scored as 8/10 and 100/100. The point value calculated for these two assignments would be 108/110, or 98%. The percent value calculated would be 80% and 100%, or 90% for the Category.
In Progress Grades
The In Progress grade also calculates from student scores, based on the grading scale selected in the Grade Calc Options. The Grade Calculation Option to Calculate In Progress Grade must be selected for these columns to appear. This section also includes the aggregate points earned by the student and the total points possible across assignments.
The In Progress Percent calculated will be affected by the following settings:
- Whether a Multiplier is entered for a Scoring Alignment. This value will only affect the percentage if the Grade Calc Option to Use score's % value is not set.
- Whether the Grade Calc Option to Use score's % value is set. For example, two assignments are scored as 8/10 and 100/100. The point value calculated for these two assignments would be 108/110, or 98%. The percent value calculated would be 80% and 100%, or 90% for the two.
- Whether a Weight is entered for a Category AND whether the Category is marked to be Excluded from calculation.
Posted Grades
See the Posting Grades article for more information about posting grades.
Save
Save
Tool Search: Grade Book
The scoring analysis options available in the Grade Book differ based on whether the task you're scoring uses Points/Marks or Rubrics.
You can score standards with any of the three options, but grading tasks can only be scored with Points or Marks.

Points and Marks express student performance as a number, such as 7/10 points or 85%. Rubrics describe the quality of student performance, such as Developing or Proficient.
Points and Marks represent "traditional grading," whereas scoring with rubrics applies a "standards-based" approach.

Options Available for Standards-Based Grading
Standards are scored using Rubrics, which measure proficiency rather than assigning a numeric score to the student's performance, but they can also be scored with Points or Marks. This article describes scoring analysis options specifically for Rubrics.
Calculating grades based on these proficiency scores is determined by the options selected for the standard in the Grade Calculation Options, which must be established for In Progress proficiency estimate to calculate.
The following sections describe:
- Sparkline Graphs, which summarize individual student performance.
- Proficiency Graphs , which display student performance in relation to other students in the section.
- The Proficiency Distribution that displays for an assignment or category.
- The Grade Totals section that includes In Progress calculations and posted grades.
Sparkline Graphs
If you've set the Sparkline Graph preference, a green and red sparkline graph displays next to the student's name. This graph displays condensed student performance data based proficiency scores, with each bar representing one assignment along an axis of proficiency and the height of each bar based on the number of rubric score options. Passing scores show as a green bar and go upwards from the axis, while failing scores show as a red bar and go down from the axis. This graph is always displayed chronologically, regardless of assignment sort options.
Hover over the sparkline graph to view a tool tip indicating the number of scores represented in the graph.

Sparkline Graph Example
In this example, there are four score options, two considered Proficient: HP: Highly Proficient, P: Proficient, and two considered Not Proficient: S: Improving, and U: Unsatisfactory.
Displaying a graph for a standard that has many assignments may cause student names to be hidden behind the graphs. If this occurs, turn off the preference to show graphs.
Proficiency Graphs
In place of the Box and Whisker diagrams shown for assignments scored with Points/Marks, Standards scored with Rubrics display graphs in the expanded Student area, one displaying a student's proficiency over time and the other showing the proficiency distribution across all students in the section.
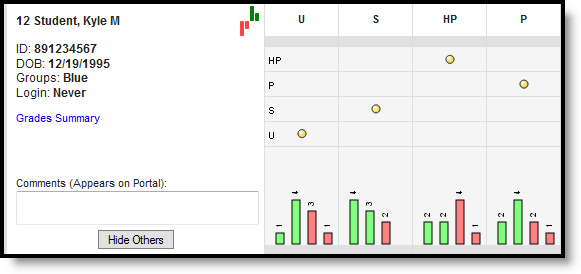
Proficiency Graph Examples
The Student Proficiency graph depicts student proficiency across all Rubric proficiency levels. The Proficiency Distribution graph aggregates how many students were scored at each proficiency level across the section, from the score with the highest sequence to the lowest.
Note: The proficiency graph does not display for standards scored using rubrics with more than 20 options.
Proficiency Distributions
Hover over an assignment header to view the proficiency distribution tool tip, which includes the possible proficiency levels and the distribution of all students across the proficiency levels.
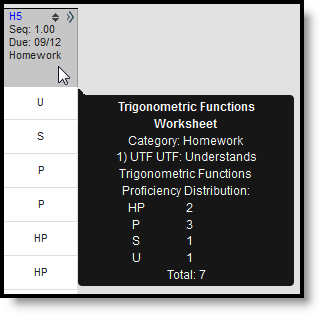
Proficiency Distribution Across the Section for an Assignment
Rubric-Based Grade Totals
For assignments scored using Rubrics, In Progress proficiency estimates are calculated based on the Proficiency Estimate option selected for the Term/Standard in Grade Calculation Options. These columns include Posted and In Progress as well as a calculated value per assignment Category.
In Progress values calculate automatically based on scores entered and cannot be directly modified. Posted grades appear on the student's Grades tab. Grades in the Posted column can be modified as desired by the teacher; updated grades post upon save.
Columns and calculations in the In Progress section differ based on the Proficiency Estimate option selected.
| Proficiency Estimate Calculation | Description |
|---|---|
| Highest Score | Indicates the highest proficiency level the student has achieved. Sequence must be entered for items on the Rubric for this option to calculate correctly. |
| Mode of 3 | Indicates the most common score for the student across the most recent three scores. |
| Mode of 5 | Indicates the most common score for the student across the most recent five scores. |
| Power Law | Power Law is a mathematical calculation that converts proficiency levels into numeric values and determines a trend based on the student's scores, locating the student between introduction and full mastery. See the Posting Grades article for information about using Power Law. |
| Most Recent | Indicates the most recent proficiency level the student has achieved, based on assignment due date. If the most recent due date has multiple assignments, those assignments must have sequence values to report a Most Recent proficiency estimate. The most recent value calculates from the assignment with the highest sequence number on that day. |
Use ALT L to expand and collapse this area.
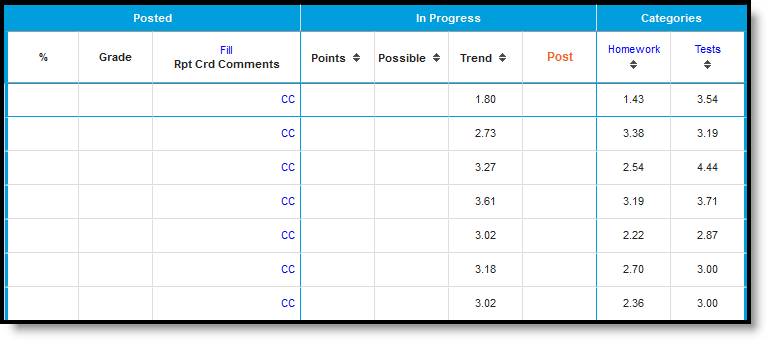
In Progress Proficiency Estimate when using Power Law
In Progress proficiency estimates are available for students to view on the Portal. Posting Grades is the action of publishing grades to the transcript.
Categories
A column displays for each Category in the Term and Task selected. Each category calculates a based on the grade calculation option selected.
Categories marked as Exclude still have a proficiency trend calculated but are not included in the In Progress calculations. Excluded categories appear in red text.
In Progress Proficiency Estimates
When using Rubrics-based scoring, the Points and Possible columns remain blank.
Hover over the student's trend value/proficiency estimate to view a tool tip with all four proficiency calculations.
When using Power Law:
A Trend estimate calculates in the In Progress section based on the trend calculations for each Category. This trend value represents the student's progress as a numerical value on a scale where each "point" aligns to a rubric score. For example, on the four value rubric described above, a trend value of 2 would align to a proficiency level of S, and a 4 would align to HP.
When using Highest Score, Mode of 3 or Mode of 5:
The Proficiency Estimate calculates based on the grade calculation option selected for the standard.
Posted Grades
When posting grades for rubric-based tasks using Power Law, enter grades manually. Otherwise the Proficiency Estimate calculates. See the Posting Grades article for more information about posting grades.
Automatic posting means clicking Post moves the In Progress proficiency estimate to the Posted column. Manual means that the teacher is responsible for analyzing the data and determining the student's performance. The posting options available depend on the grade calculation options selected for the standard.
| Grade Calculation Option Chosen | Posting Options | |
| Manual | Automatic | |
No Calculation | X |
|
Proficiency Estimate - Highest, Mode of 3, Mode of 5 | X | X |
Proficiency Estimate - Power Law | X |
|
Save
View Students' Score Statistics
For each assignment, a diagram will appear in the Grade Book comparing a student's performance in relation to other students in the section. These examples include Sparkline Graphs and/or a Box and Whisker diagram. In addition, a calculation summary will display for all scored student assignments.
The Grade Book provides various score statistics information for all assignments. This video demonstrates how to view students' score statistics for all assignments in the Grade Book.
View Students' Score Trends
From the Grade Book, a Sparkline Graph displays next to each student's name showing his or her trend in the class. Depending on if a grading task or standard is selected, either a line graph or a bar graph will appear.
In this simulation, the user will learn how to view and analyze a Sparkline Graph related to a student's score trends.
Post Grades via Grade Book
Post Grades and Standard Scores
From the Grade Book, teachers can post grades for grading tasks and/or standards for the course sections that they teach. Posting grades will copy the grades entered in the Grade Book to a student's Grades tab. Teachers will not always see the Post option in the Grade Book until the Grading Window is open.
Location: Grade Book > click Post (if Grading Window is open)
Posting grades copies the grades entered in the Grade Book to students' Grades tab. This is also the grade that posts to the students' Transcripts using the Transcript Post Wizard, if Post to Transcript is marked for the grading task or standard.
Automatic posting means clicking Post moves the In Progress grade or proficiency estimate to the Posted column. Manual means that the teacher is responsible for analyzing the data and determining the student's performance. The posting options available depend on the Grade Calculation Options selected.
| Grade Calculation Option Chosen |
Posting Options | |
| Manual | Automatic | |
|
No Calculation |
X |
|
|
In Progress Grade |
X |
X |
|
Proficiency Estimate - Highest, Mode of 3, Mode of 5, Most Recent |
X |
X |
|
Proficiency Estimate - Power Law |
X |
X |
Grades can only be posted if the Grading Window is open for the selected Task or Standard.
The grading window may be open for some students and not for others. Students for whom grades cannot be posted display in gray and uneditable. Hover over a cell of the Posted column to see if grades can be posted for a student.
Posting Grades*
* Posting grades is different for standards where the In Progress grade is calculated using Power Law.
Step 1: Populate Posted Grade Column
|
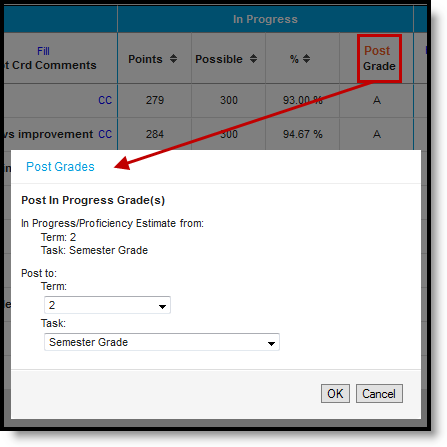
To post grades, review the In Progress portion of the Grade Totals. Click the red Post button to open the post grades window. Limit the students for who grades are posted by selecting a Student Group or using the filtering options.
The popup shows the source and destination of the grades you are posting. The current Term and Task appear in the from section and is selected by default in the Post to dropdown lists.
Change the destination term and task if you want to post the grades to another task, such as posting to a Progress Report task that is used to report grades but doesn't have any assignments. The Grading Window must be open for the destination grading task or standard. The grading window does not need to be open for the source term and task.
Click OK to copy grades from the In Progress columns to the Posted section, if the In Progress grade is a valid option in the score group. Grades are not yet posted. If you posted grades from one task another, the grade book switches to the context of the destination task. |
|
Step 2: Review Grades
|
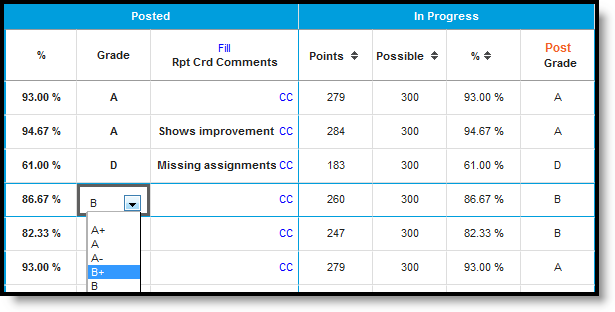
Review the Posted grades and make modifications as desired, such as a grade that could round up to the next letter grade. Options in the grade dropdown list are based on the score group aligned to the grading task, rather than the grading scale which determined the In Progress grade.
Enter any comment in the Report Card Comments column (2500 character limit), use the Fill option to add comments for multiple students, or click the CC (canned comments) link to open the comments window. |
|
More about Canned Comments:
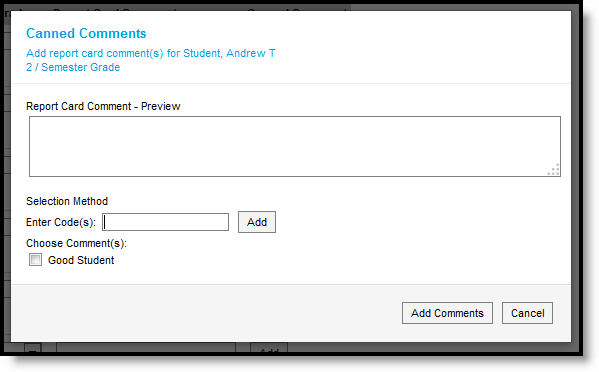
Enter comments in any of the following ways:
- By entering text in the Preview text box.
- By entering a numeric Code for the comment and clicking Add.
- By marking the checkbox next to the canned Comment.
As you add comments, they all appear in the Preview box, where you can modify as needed. The Canned Comments catalog is made in Grading Comments.
Enable Canned Comments by marking the preference in the Grade Book. You can only select canned comments if custom comments are disabled in your district's System Preferences.
Note: Grades do not populate in the Posted columns for students who have dropped the section. Manually select grades in the Grade column to post grades for dropped students. Dropped students display in red text in the grade book and only display if the Account Setting Show Active Students Only is turned off.
Step 3: Post Grades
Click Save in the Grade Book to post grades.
Manually Posting Grades
Posted grades can be entered manually in the Posted columns, bypassing assignment scores and In Progress grades.
- By Percentage: Type percentages in the Posted Percent column, which calculates the Posted Grade based on the Grading Scale selected in Grade Calculation Options.
- By Grade: Click the a cell in the Posted Grade column to select a grade from the score group from the dropdown list.
Click Save to post the entered grades.
Posting Grades when Using Power Law
If a rubric score displays in the Post column automatically, read this section.
Power Law is a mathematical calculation that converts proficiency levels into numeric values and determines a trend based on the student's scores. Power Law works on the assumption that standards are assessed at consistent intervals, such as weekly.
Rubric scores are converted using the Numeric Value entered on the Rubric and then the Power Law trend value is converted back into a rubric score based on the trend ranges also entered on the rubric.
For example, you've assessed your class for the same standard each Tuesday for the last few weeks, using a 4 point rubric of U, S, P and HP. Kyle has attained the following proficiency levels:

Using Power Law, his calculated trend value is 3.46, shown in this diagram:
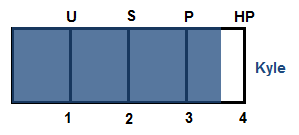
Power law trend values provide a guide for teachers in determining a student's overall proficiency in a standard. When given a series of proficiency estimates, teachers don't have to determine what those estimates mean together.
To post grades, click the red Post button in the In Progress column and choose the Task to post to. In the Posted section of the Grade Totals, you have the option of changing the student's grade if desired.
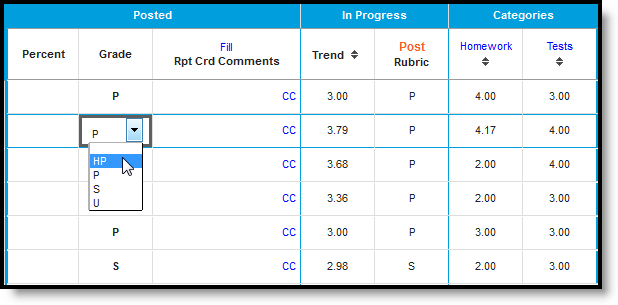
Selecting Posted Grades when using Power Law
Enter comments as described above.
Once you've verified all student grades, click Save to post grades.
Save
The Grade Book tool allows teachers to post grades for grading tasks and/or standards. This video demonstrates how to post grades and standard scores.
Previous Versions
Post Grades (Grade Book) - Video [.2016 - .2503]
Post Grades for Multiple Sections
The Multi-Post Grades tool allows teachers to post and update grades for multiple grading tasks or standards at the same time from multiple sections. This functionality can be accessed from the Post Grades tool, the Grade Book, and the Progress Monitor.
Location: Grade Book > expand Settings menu > Multi-Post Grades; Progress Monitor > Multi-Post Grades; Post Grades > Multi-Post Grades
The Multi-Post Grades tool allows teachers to post grades for multiple tasks or standards at the same time. Grades are sourced from the In-Progress grades area of the Grade Book. This tool can save time for teachers who have to post grades often (such as to a weekly Progress task) or who have to post grades to many tasks or standards.
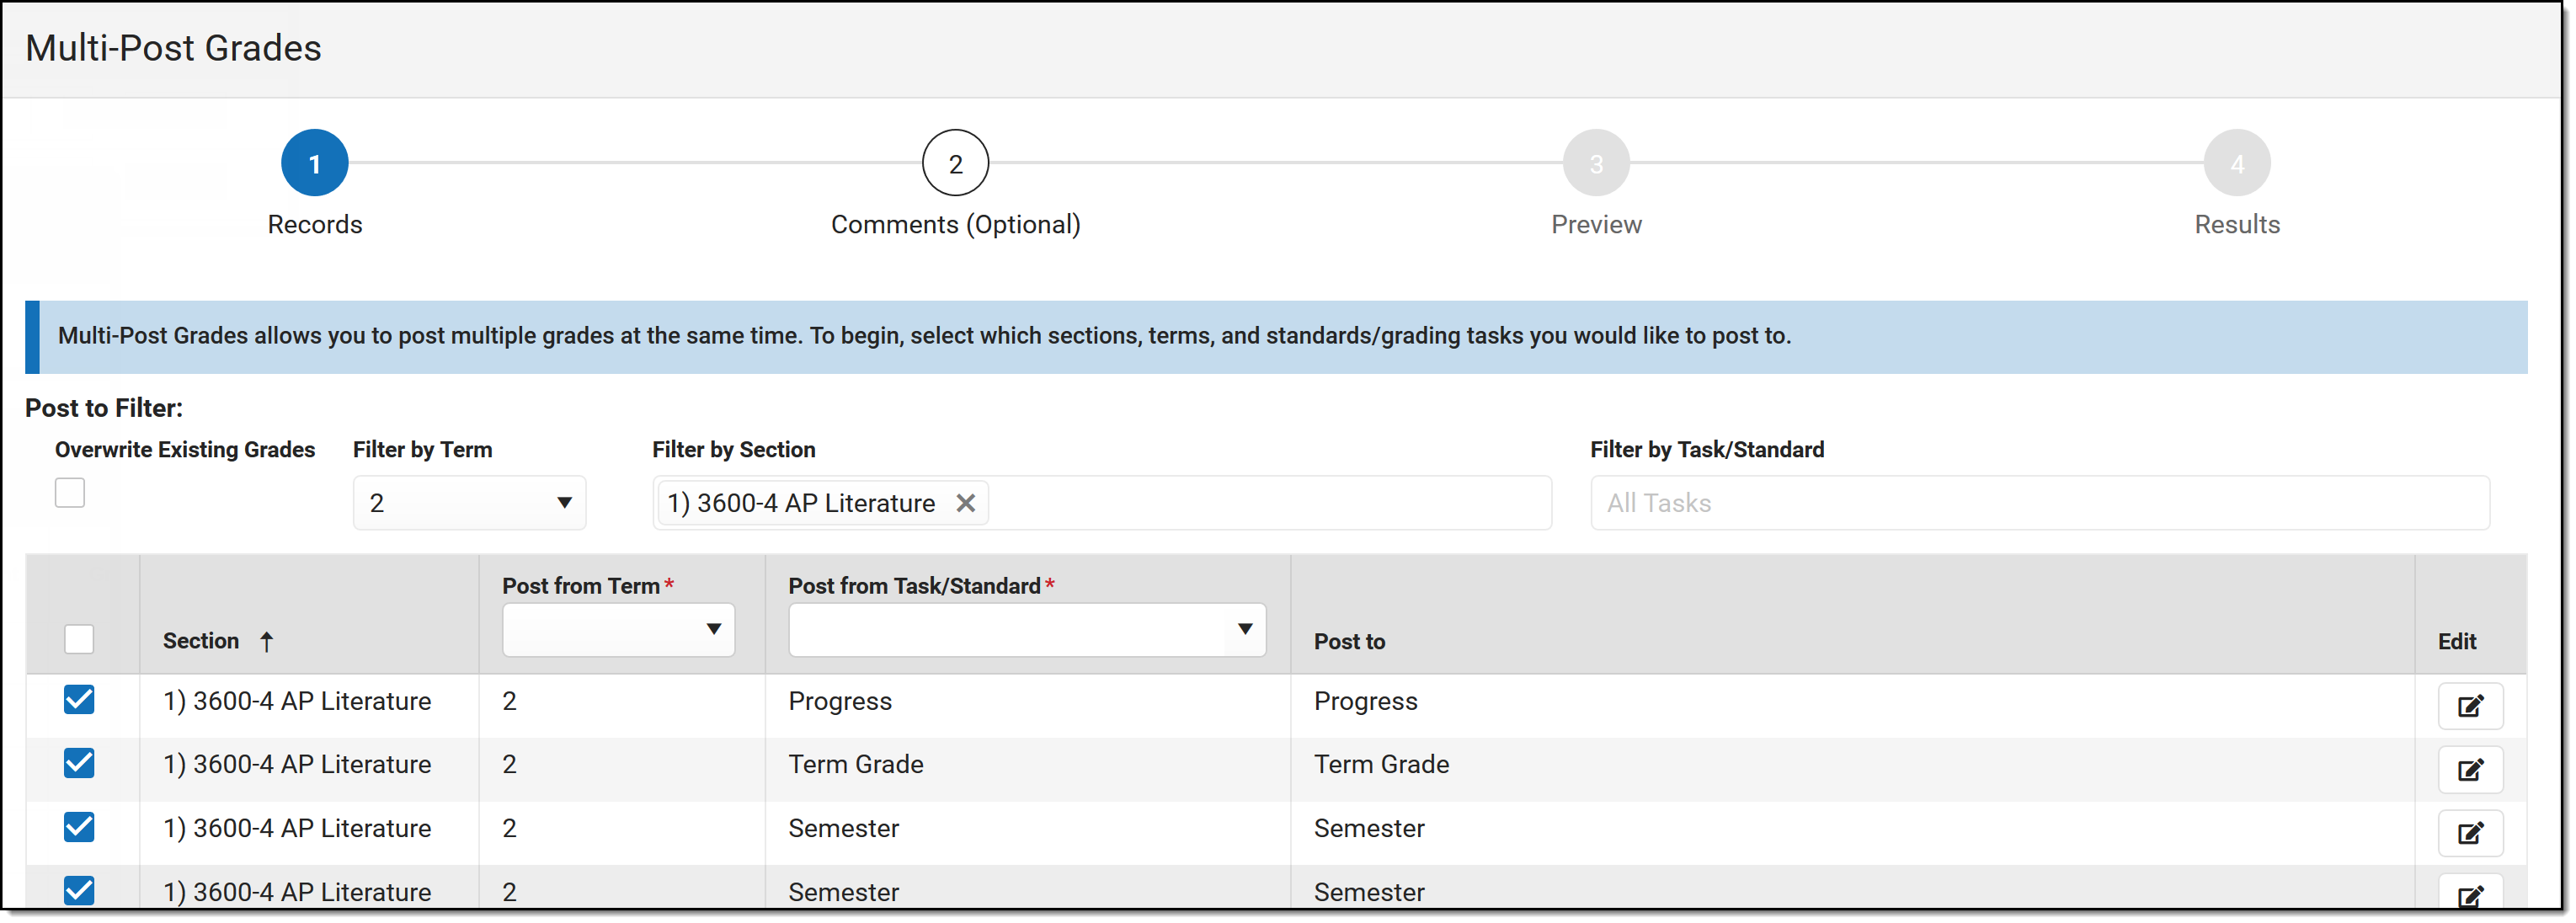
Use the Multi-Post Grades tool to post grades to multiple tasks/standards en masse.
The Multi-Post Grades tool right in Additional Access Rights > Instruction Tools is required to access this tool.
See the Instruction Tool Rights article for more information.
Access the Multi-Post Grades tool from the Settings menu of the Grade Book, from the Post Grades tool, or from the Progress Monitor.
Because the Multi-Post Grades tool pulls in-progress grades and proficiency estimates from the Grade Book, the Grade Calculation Options for each section must be set up. Additionally, tasks and standards must be added to a course to be used in the posting process.
Step 1 - Select Source and Destination
The first step of posting grades en masse is selecting which source sections/tasks are posting to which destination tasks. The scenario shown in the images below is of a teacher posting a Progress grade for her sections from the Term Grade task.
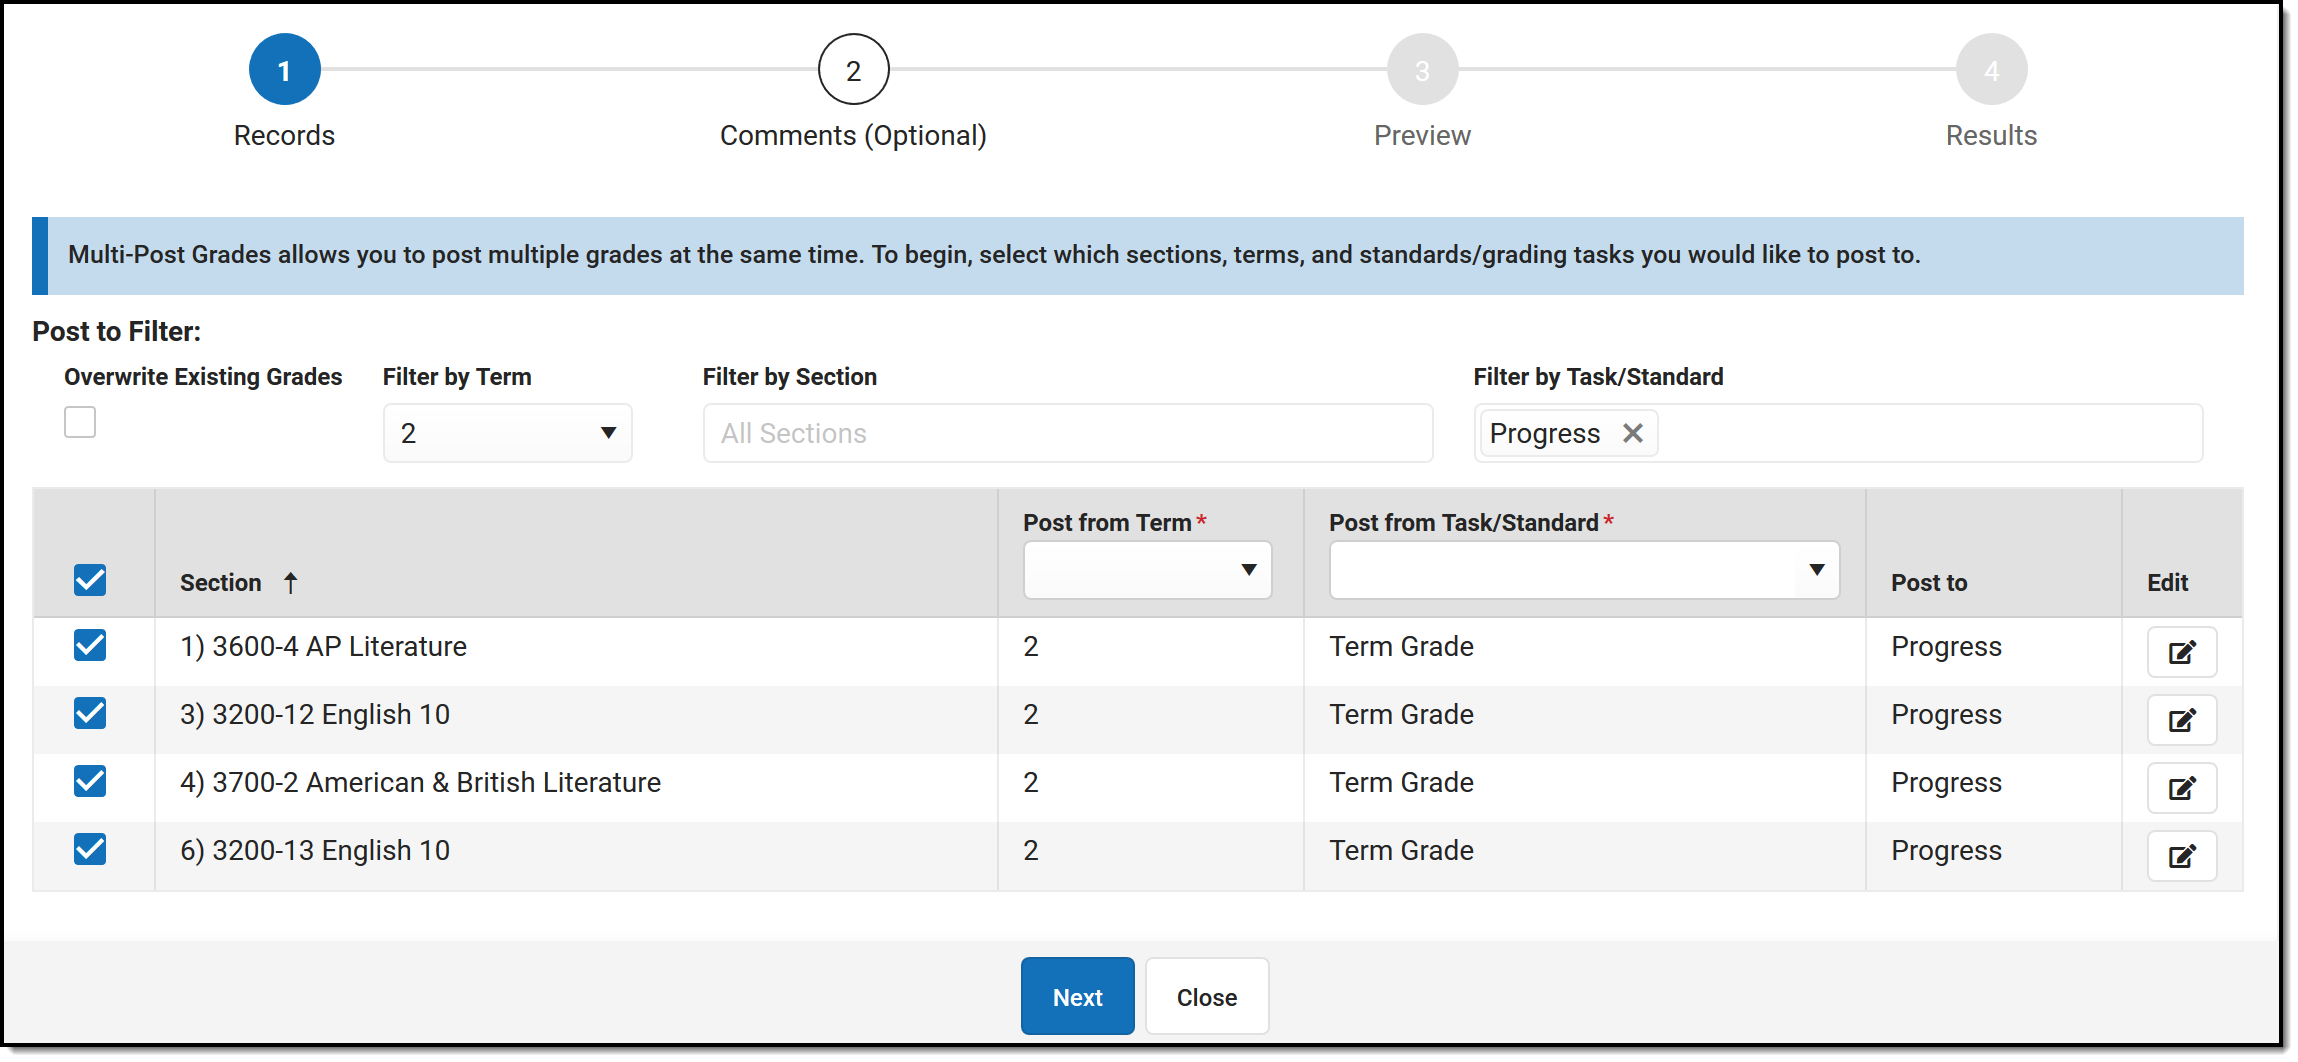
Step 1: Selecting Destination and Source
- Indicate if grades being posted should Overwrite Existing Grades that have already been posted.
- Filter the list of destination sections and tasks by Term, Section, and Task/Standard. Multiple sections and tasks can be selected. The table below is filtered based on these selections and shows the sections and tasks/standards that grades will be posted TO. The grading window must be open for at least one task in the section for it to display.
- Indicate where grades should be posted FROM by selecting the Term and Task/Standard that serve as the source of the posted grade. Click the Edit button at the right of each row to edit.
- The destination sections listed in the Post to column depends on the Filter by Task/Standards selected above the table.
- Click Next to review comments.
Step 2 - Comments
Step 2 is optional. If desired, enter report card comments. Click Next when finished or Skip to move to step 3.
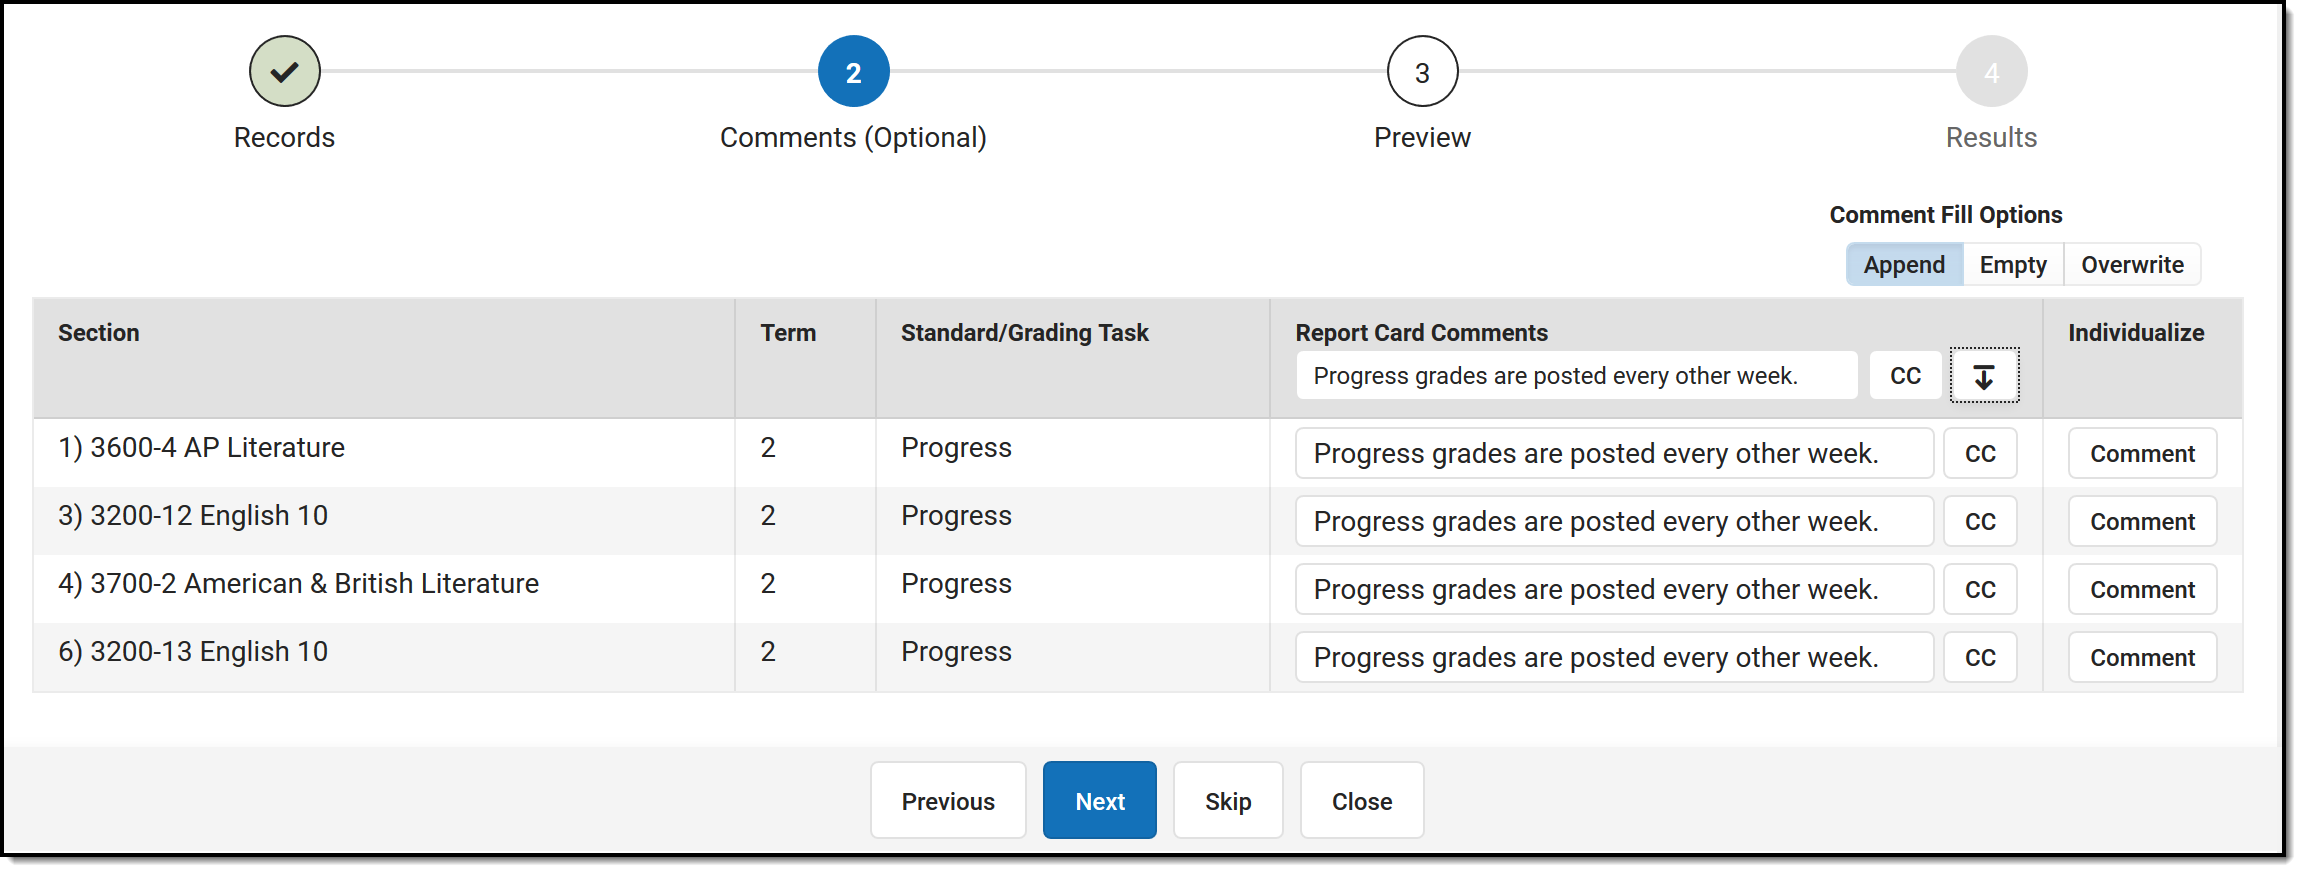
Step 2: Entered report card comments by section or individually.
If any of the selected sections have unreleased scores, a message displays at the top indicating that In-Progress grades may be incomplete. See the Release Scores article for more information.
In-Progress grades/Proficiency Estimates are calculated using only released scores. To see the difference between the In-Progress Grade calculated using all scores or only released scores, visit the Grade Book or Progress Monitor and toggle between the two calculation options. To release all scores prior to posting, visit the Curriculum List, filter to only Unreleased assignments, and click Release All Scores.
Options available may vary based on your district's setup. See the Commenting in Campus Instruction article for more information about where these comments display for students and parents.
Comments typed in a section's row are included for all students in that section. If enabled, click ![]() to view a list of available canned comments.
to view a list of available canned comments.
To provide different comments by student, click the  button in the Individualize column to enter comments by student.
Comment Fill Options
Fill comments by entering them in the table header and pressing ![]() . The Comment Fill Options above the table determine how filled comments are applied:
. The Comment Fill Options above the table determine how filled comments are applied:
- Append: adds the entered comment to any existing comments for all students.
- Empty: adds the entered comment for any students who do not yet have a comment.
- Overwrite: overwrites any existing comments with the entered comment for all students.
Step 3 - Preview Prior to Post
The preview screen summarizes what grades will be posted.
The New/Updated Grades column shows the number of students for whom grades will be posted and the No Grades column indicates students who do not have a grade to post.
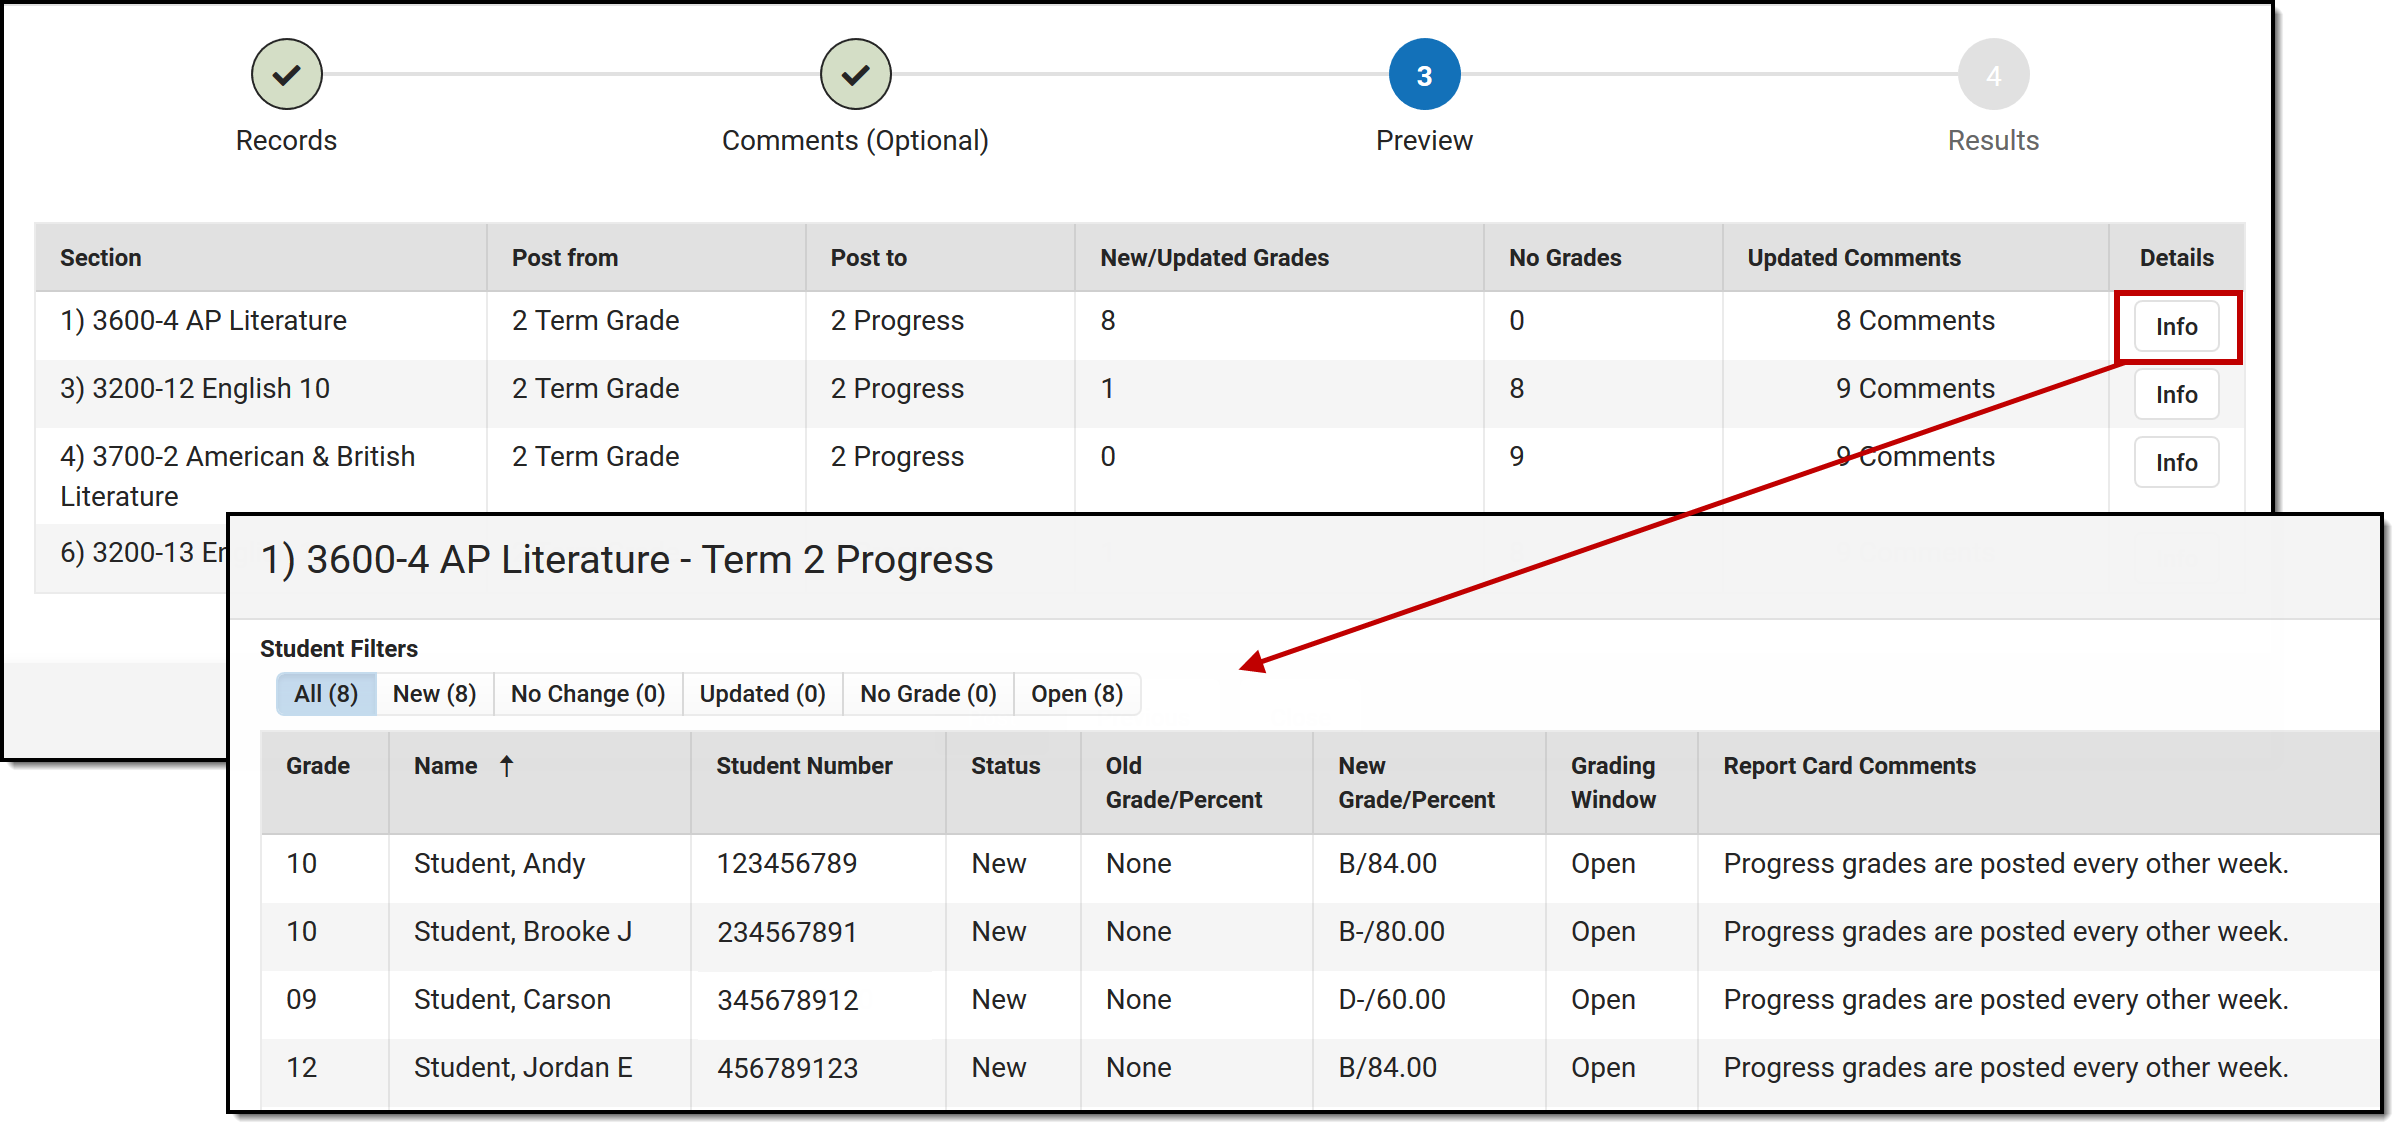
Step 3: Review grades before you post.
Click ![]() to view a list of students with old and new grades.
to view a list of students with old and new grades.
| Column | Description |
|---|---|
| Status | Indicates if the grade being posted is a new grade, is updating (overwriting) an already posted grade, or is an existing grade that will not be overwritten. This column also indicates if there is no grade to post or no change in the grade. |
| Old Grade/Percent | Shows any existing posted grade/percent for the student. |
| New Grade/Percent | Shows the grade that will be posted when the teacher clicks Post on the summary screen. |
Filter the student list using the options at the top:
- All: Shows all students in the section.
- New: Shows students for whom new grades will be posted.
- No Change: Shows students who have existing grades that will not be overwritten when grades are posted.
- Updated: Shows students who have existing grades that will be overwritten when grades are posted.
- No Grade: Shows students who do not have an In-Progress grade or Proficiency Estimate in the Grade Book to post.
- Open: Shows students for whom the grading window is open.
Step 4 - Post Grades
After reviewing grades to be posted, click Post to post grades. Click Close to return to the Grade Book or Post Grades tool.
Printing a Report
Click Generate Spreadsheet to generate a report of posted grades. This report can also be generated as a PDF by clicking the arrow next to the Generate button and selecting Generate PDF.
Save
Save
The Multi-Post Grades functionality allows teachers to post grades for multiple sections from Post Grades, Progress Monitor, or the Grade Book. This video demonstrates how to use the Multi-Post Grades functionality.
Previous Versions
Multi-Post Grades (Grade Book) - Video [.2403 - .2503]
The Multi-Post Grades functionality from the Grade Book can be used to post grades for multiple courses at one time. In this simulation, a teacher needs to post mid-term grades for multiple course sections.
The Post Grades Tool
Post Grades and Standards Scores using the Post Grades Tool
From the Post Grades tool, teachers can manually enter and post all student grades without needing to use in progress grade calculations. Additionally, teachers can also enter percentages and report card comments.
Tool Search: Post Grades
Using the Post Grades tool, you have the option of posting grades by task or by student. When using this tool, you are posting grades for the entire task or standard, rather than entering scores for a specific assignment. Posted grades appear in the students' Grades tab and is the grade that posts to the students' Transcripts using the Transcript Post Wizard, if Post to Transcript is marked for the Grading Task or Standard.
 Use the Post Grades tool to post grades by task/standard or by student.
 See the Instruction Tool Rights article for more information.
Grades can only be posted to open (or active) grading tasks. If a task is selected that has no fields available for entering student grades, the task is not active for grading at this time. Tasks can be activated using the Grading Window. The grading window may be open for some students and not for others. Students for whom grades cannot be posted display in gray and uneditable.
A warning message displays at the top of the screen if the section includes any assignments that have unreleased scores. See the Release Scores article for more information.
In-Progress grades/Proficiency Estimates are calculated using only released scores. To see the difference between the In-Progress Grade calculated using all scores or only released scores, visit the Grade Book or Progress Monitor and toggle between the two calculation options. To release all scores prior to posting, visit the Curriculum List, filter to only Unreleased assignments, and click Release All Scores.
Scores and percentages that appear automatically have already been posted using the Grade Book.
Select the Section and Term from the dropdown lists at the top to populate the Task and Student dropdown lists with available options.
See the Using Rollup Grade Calculations article for more information about grading standards using the rollup calculation provided. This option can be set up in the Grade Calc Options for the Course or Course Master.
Posting by Task
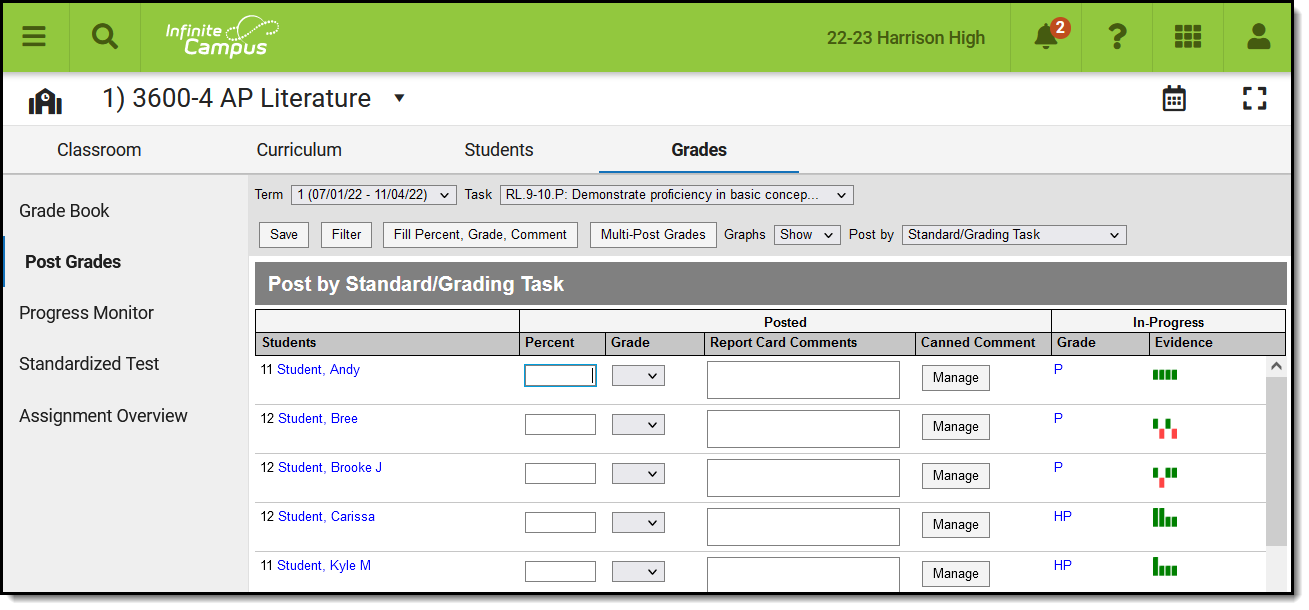
To post by task, select Standard/Grading Task from the Post by dropdown list and a Task. All students in the selected section are listed.
Alternately, select All Standards and Grading Tasks from the Post by dropdown list to all tasks and standards aligned to the section. This option is useful when entering grades for parent standards based on the student's performance on child standards.
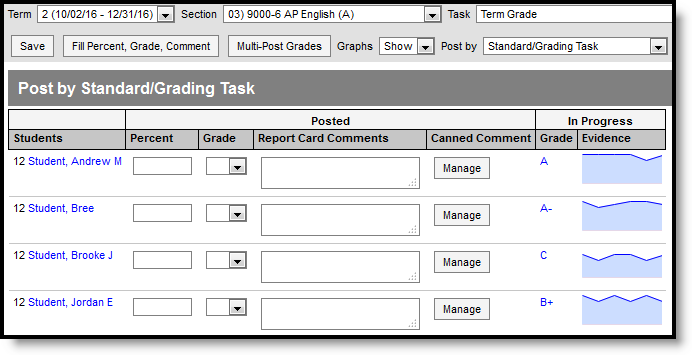
Posting Grades for a Standard or Task
Enter a Percent (if you're grading a task) and select a Grade from the score group or rubric aligned to the task or standard. Review the In Progress information populated from the Grade Book, including a grade and graph, as a guide for selecting a grade. (See the image in the Posting by Student section below for an example of the sparkline graph shown for standards.)
Comment options depend on district settings. If custom comments are enabled, enter any Comments for the report card using the text box. If Canned Comments are available, click Manage to access the canned comments window. Comments can be up to 2500 characters in length.
Click Save when finished to post grades.
Fill Options
Rather than entering grades individually for each student, you have the option of using the Fill tool.
Click Fill Percent, Grade, Comment to open the fill window.
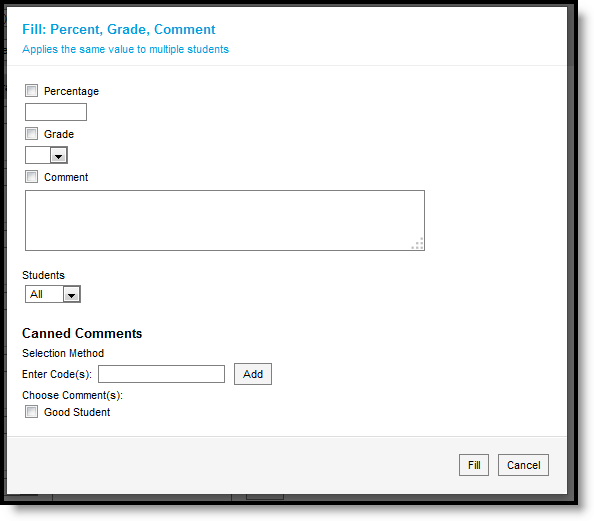
Enter the Percentage, select the Grade and enter any comments (using the text box or Canned Comments below). Then select which students whose grades you want to fill, all or only where fields are empty.Click Fill when finished.
Grades are only filled for tasks with the same Score Group.
Posting by Student
When posting by student, select a Student from the dropdown list. All standards and tasks assigned to that section appear. A filter is automatically applied to only show the selected term.
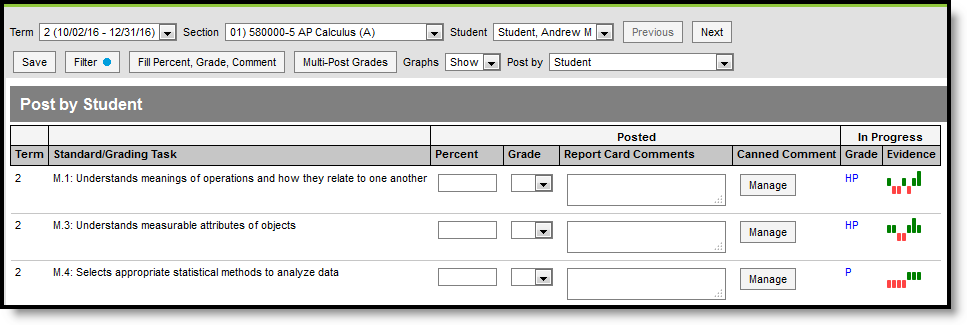
Posting Grades for a Student
Enter a Percent (if you're grading a task) and select a Grade from the score group or rubric aligned to the task or standard for each standard or task. Review the In Progress information populated from the Grade Book, including a grade and graph, as a guide for selecting a grade. (See the image in the Posting by Task section above for an example of the graph shown for tasks.)
Comment options depend on district settings. If custom comments are enabled, enter any Comments for the report card using the text box. If Canned Comments are available, click Manage to access the canned comments window. Comments can be up to 1200 characters in length.
Click Save when finished to post grades.
Filter Options
When posting grades by student, a filter option displays at the top of the screen. Use filter options to limit the Standards and Grading Tasks shown for the selected student.
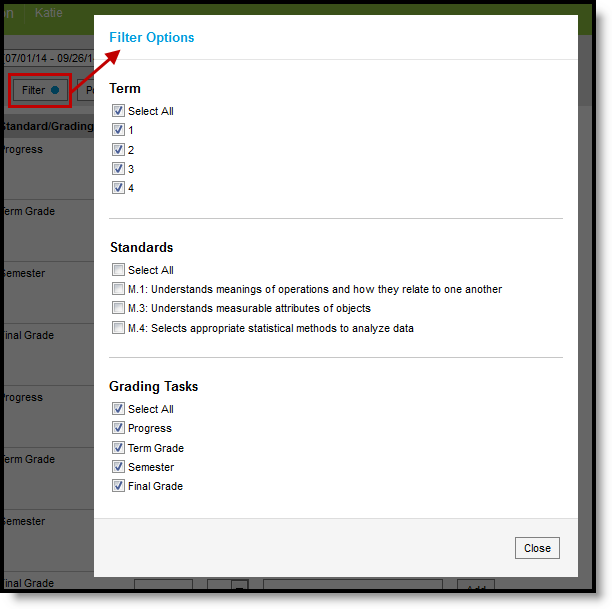
Filter Options when Posting By Student
To filter, select which Terms, Standards, and Grading Tasks to include. A blue dot appears on the Filter button when a filter is applied to your view.
Canned Comments
Click Add to open the canned comments window.
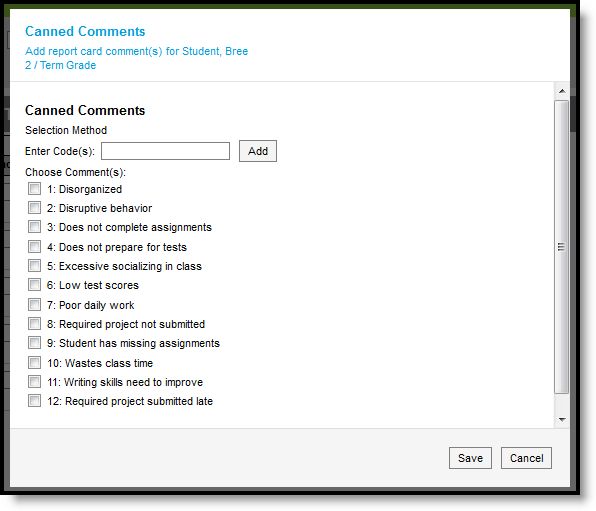
Enter comments in either of the following ways:
- By entering a numeric Code for the comment and clicking Add.
- By marking the checkbox next to the canned Comment.
The Canned Comments catalog is made in Grading Comments.
Enable Canned Comments by marking the preference in the Grade Book. You can only select canned comments if custom comments are disabled in your district's System Preferences.
The Post Grades tool allows teachers to post grades for grading tasks or standards without using the in-progress grade calculation. This video demonstrates how to use the Post Grades tool.
Previous Versions
Post Grades (By Task or Student) - Video [.2403 - .2503]
Using the Post Grades tool, teachers can manually enter and post all student grades without needing to use the in progress grade calculations.
Assignment Overview
View Assignments in Assignment Overview
From Assignment Overview, teachers can view and manage all assignments and categories within an assigned course section.
Tool Search: Assignment Overview
The Assignment Overview provides a list of all assignments in a section, grouped by Standard/Task and Category.
To view assignments, select a Term and then a Section in that term at the top of the tool.
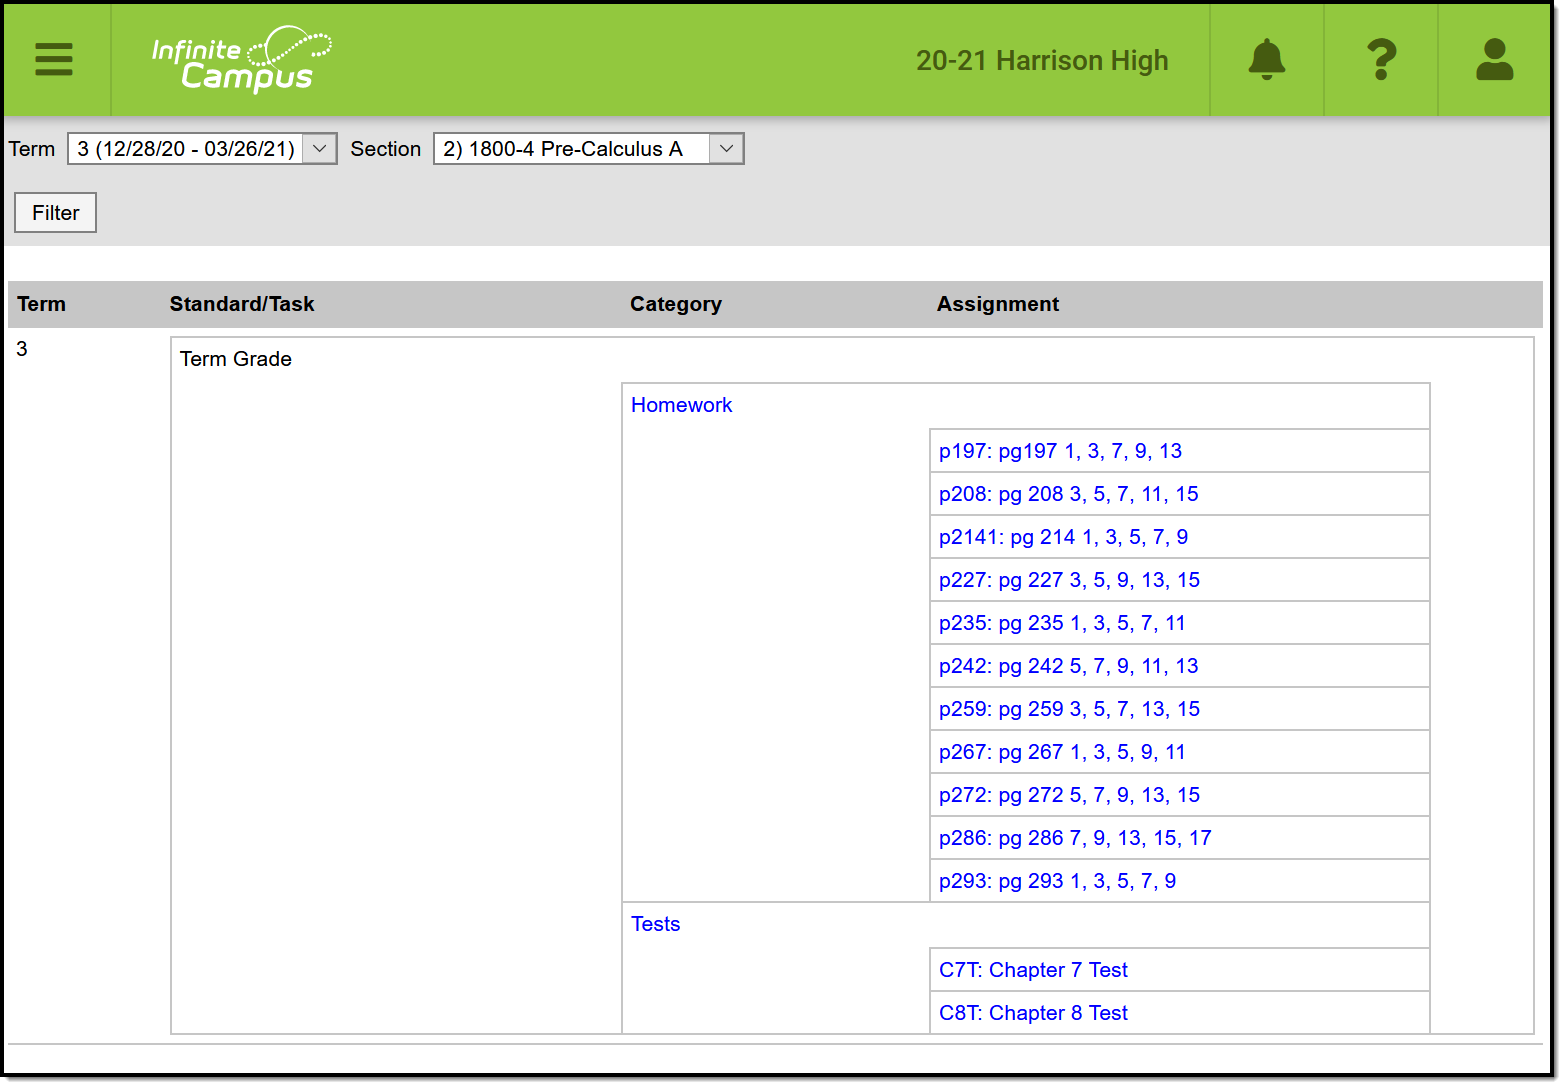 The Assignment Overview groups assignments by Standard/Task and Category.
See the Instruction Tool Rights article for more information.
Click an assignment to view a read-only version of it. From the assignment, you can edit it or create a new one. See the Assignments & Resources article for more information. Assignments that are not included in grade calculation are prepended by an *.
Filtering the Assignment Overview
Click Filter to view the filtering options for which Terms, Standards, and Grading Tasks display in the overview. A blue dot appears in the Filter button when a filter is set.
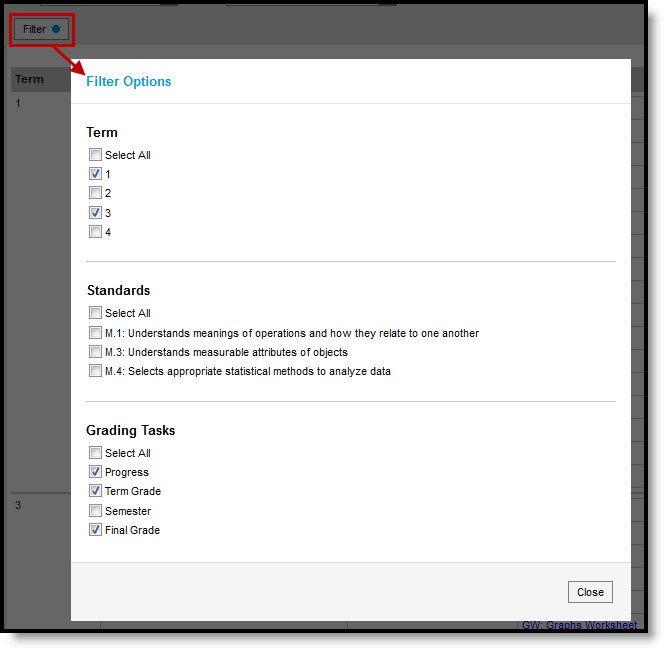 Filter the overview by Term, Standards, and/or Grading Tasks.
From Assignment Overview, teachers can view and manage all assignments and categories within an assigned course section. In this video you will learn how to view and manage assignments from Assignment Overview.
Reports
Generate Campus Instruction Reports
From Campus Instruction, teachers can generate many different reports to analyze, track, and summarize commonly used features such as Attendance, Planner, Roster and the Grade Book.
Instruction reports help teachers to analyze grade, assignment, and attendance data, generate helpful forms, and track student work.
See the Instruction Tool Rights article for more information about the rights needed to access reports.
Tips for Generating Reports
- When you click Generate on a report, whatever options you've selected are saved for the next time you return to the report. This feature saves time on reports you generate often, or when generating a report with the same option for different sections.
- Most reports are available in PDF and DOCX format. Some are also available in CSV (Excel) and other helpful formats. To view additional formats, click the arrow next to the Generate button.
- Students who have recently added a class are shown in green text (depending on district preference) and students who have dropped a class display in red text.
Saving Report Options as Templates
At the bottom of the editor for most reports, click Save Options to save the report editor options as currently selected as a template for future use. Give the template a name before saving.
To use a set of saved options to generate a report, click Apply Options and select a saved template from the list in the panel on the side of the screen. The Default Report Options template restores the editor options to the original default, before you used the report and it saved your selections for next time.
Once selected, the saved options are selected on the report editor - changes can still be made to the selected options before generating the report.
Available Reports
| Report Name | Use to Report: |
|---|---|
| Assignment Analysis |
A bar chart of students' performance on the selected assignment. |
| Assignment Standards |
Standards associated with assignments for a section |
| Attendance Change Tracking |
Attendance events that have been added and changed for a date range |
| Attendance Register |
Attendance for a term in a student-by-day grid |
| Attendance Summary |
Attendance totals for a term by event type (excused, tardy, etc) |
| Blank Spreadsheet |
A blank spreadsheet of selected students, with customizable column headers. |
| Curriculum Report |
A list of assignments in the section with an overview of curriculum information. |
| Flagged Assignments |
Assignments flagged as missing, exempt, late, or incomplete for students |
| Grade Book Export |
An export of your Grade Book in another format. |
| Grades Report |
Posted grades for tasks and standards. |
| Missing Assignments |
Assignments flagged as missing per student |
| Portal Usage |
Students and parents with Portal accounts and login activity |
| Positive Attendance Section Summary |
Total time spent in class for each student in a term (positive attendance) |
| Report Cards |
Print report cards for students. |
| Roster |
Print details from a section's roster, including student demographics, guardian, and address data. This report is also available via the Report Options button in the Roster. |
| Roster Labels |
Roster labels for mailing or classroom use |
| Scoring Rubrics |
Print scoring rubrics by section. |
| Section Standards |
A list of standards aligned to the section's course |
| Section Summary |
Scores for assignments and grades for tasks and standards |
| Student Assessment Summary |
Student scores on assessments. |
| Student Summary |
Assignment scores by student. |
| Teacher Schedule |
Generates a printable version of your schedule. |
Save
From Campus Instruction, teachers can generate many different reports to analyze, track, and summarize commonly used features like attendance, assignments, and schedules. This video provides an overview of some commonly used reports and the available reporting tools.
From Campus Instruction, teachers can generate many different reports to analyze, track, and summarize commonly used features like attendance, assignments, and schedules. In this simulation, a teacher would like to generate some reports to help him prepare his students for the end of the school year.
