Tool Search: SPPI Reports
The Post School Outcomes Report summarizes the data collected in the BIE PSO Interview survey and provides a count for each of the four categories into which students fall.
This report is only available in the NASIS State Edition.
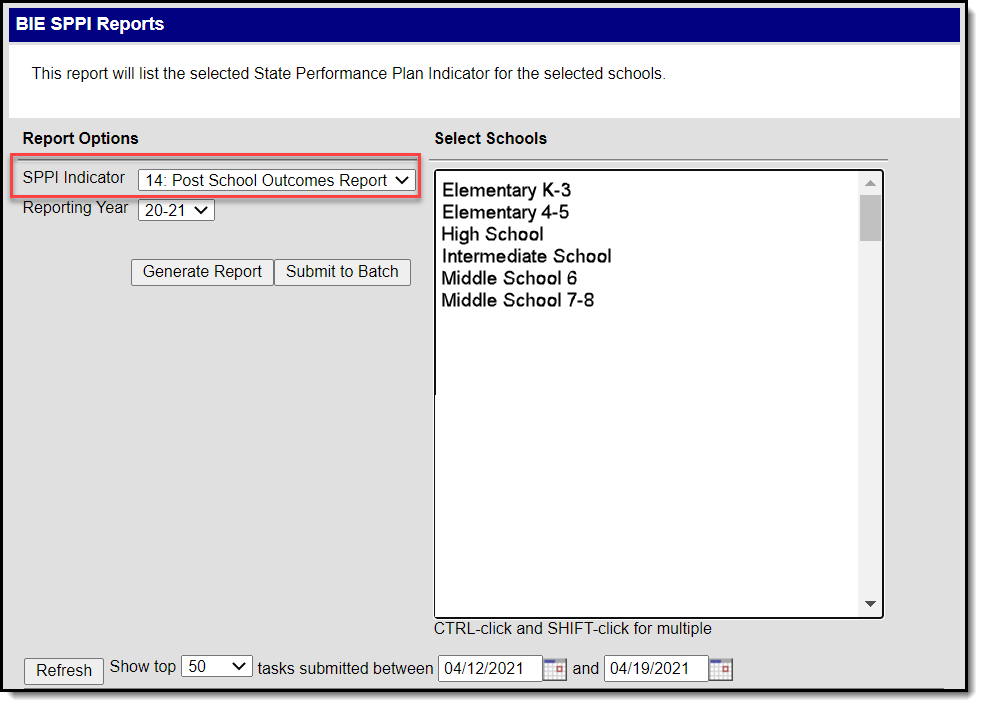 Post School Outcomes Report--SPPI Report Editor
Report Logic
The following requirements must be met to be included in the report:
- Student must have a value populated in the Diploma Date field on their Graduation tab. The date entered must be two years prior to selected reporting year.
- Student must have a completed BIE PSO Interview survey with Interview Outcome of C: Completed
Count Logic
Students are only counted once across all categories. Categories 1-4 are hierarchical and students who meet the criteria for multiple categories (based on their BIE PSO Interview survey responses) will report once for the highest category. Example: If a student meets the criteria for categories 1 and 2, they will only be counted under category 1.
| Category | Field Student Counts Under |
|---|---|
| 1. Enrolled in higher education within one year of leaving high school | Higher Education Number |
| 2. Competitively employed within one year of leaving high school and student is not enrolled in higher education | Competitively Employed Number |
3. Enrolled in some other postsecondary education or training program within one year of leaving high school (but not enrolled in higher education or competitively employed) | Other Education Number |
| 4. In some other employment within one year of leaving high school (but not enrolled in higher education, some other postsecondary education or training program, or competitively employed) | Other Employment Number |
Report Editor Fields
| Field | Description |
|---|---|
| SPPI Indicator | 11: Child Find Report 13: Secondary Transition Report 14: Post School Outcomes Report |
| Reporting Year | Identifies the year the data reports. |
| Select Schools | Identifies the school the data reports. |
| Report Generation | The report can be marked to generate immediately using the Generate Report button or can be marked to generate at a later time using the Submit to Batch button. The report generates in CSV format. See the Batch Queue article for additional guidance. |
Generate the Post School Outcomes Report
- Select 14: Post School Outcomes Report from the SPPI Indicator drop list.
- Select a Reporting Year.
- Select school(s) the report should include from the Select Schools window.
- Select Generate Report or Submit to Batch. Report displays in a new window in CSV format.
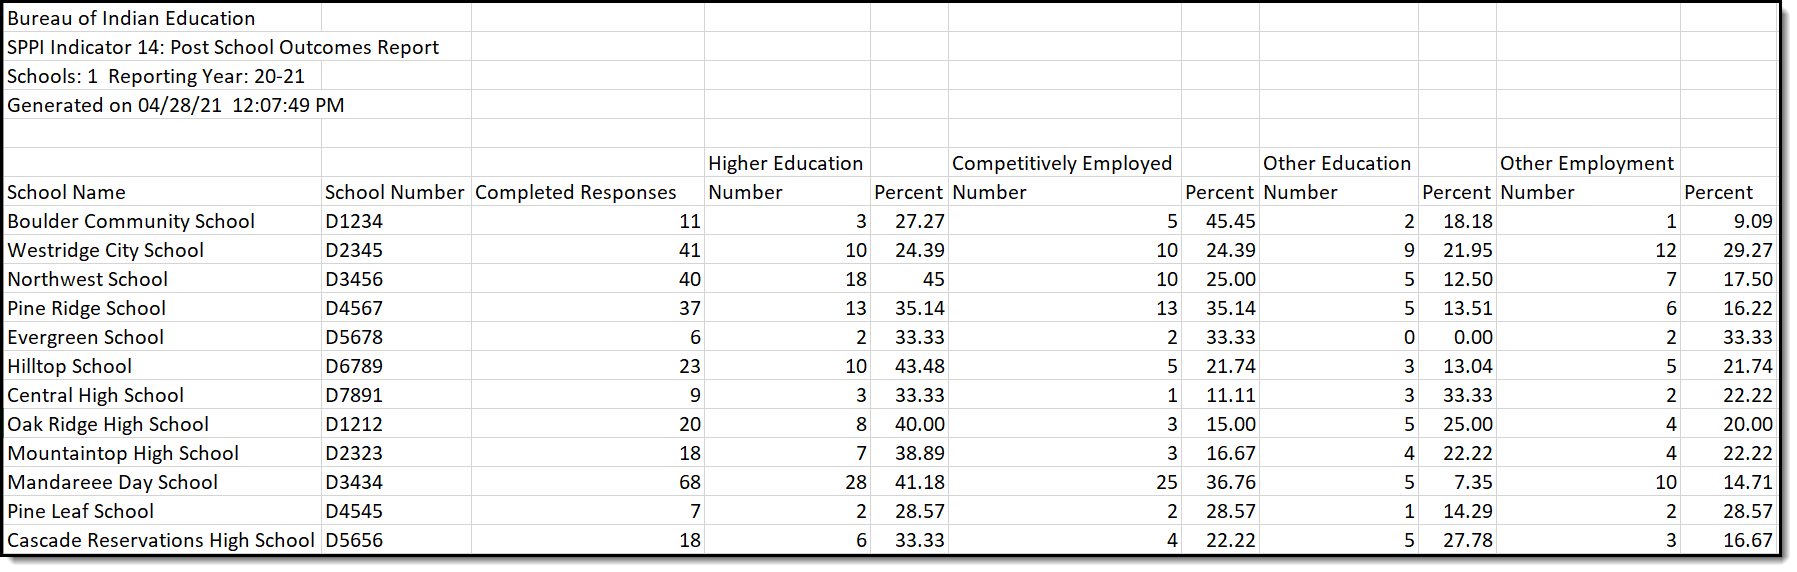 Post School Outcomes Report - CSV Format
Report Field Descriptions
| Field | Description |
|---|---|
| School Name | Reports the name of the school. |
| School Number | Reports the school number. |
| Completed Responses | Reports the count of students who exited high school (2 years prior) and have completed the BIE PSO Interview survey. Example: If a student dropped out or graduated in the 20-21 year, they would report in the 22-23 year. |
| Higher Education Number | Reports the count of completed responses for students who reported being enrolled in a post secondary program (attended a 2-4 year college or university) and completed an entire term. |
| Percent | Calculated field. Reports the percentage of students in Higher Education compared to total Completed Responses. |
| Competitively Employed Number | Reports the count of students who reported being competitively employed for over 3 months for a minimum of 20 hours per week, and making at least minimum wage. Students counted in the Higher Education category are not included. |
| Percent | Calculated field. Reports the percentage of students in Competitively Employed compared to total Completed Responses. |
| Other Education Number | Reports the count of students who are in a non-university post secondary program (i.e. job training, apprenticeships, etc.) Students counted in the Higher Education or Competitively Employed categories are not included. |
| Percent | Calculated field. Reports the percentage of students in Other Education compared to total Completed Responses. |
| Other Employment Number | Reports the count of student who reported being employed for over 3 months but do not meet the criteria of being competitively employed. Students counted in the Higher Education, Competitively Employed or Other Education categories are not included. |
| Percent | Calculated field. Reports the percentage of students in Other Employment compared to total Completed Responses. |
