Tool Search: Assessment Report
The BIE Assessment Report provides BIE district-level and NASIS state-level administrators the ability to analyze and interpret student assessment data previously collected by the BIE Assessment Data Mart tool. This tool relies on data collected by the Assessment Data Mart and does not retrieve data from any other sources or locations in Campus. Once generated, data represented in the report can be filtered, manipulated and viewed in a variety of formats that a user can externally export and share. Before using this report, review the following:
The Assessment Report uses pivot table functionality. A pivot table is a data summation tool often found in spreadsheets and other business intelligence software. Pivot table tools can sort, count, and total the data stored in a table or spreadsheet, and then display the data in a new table or chart. See the Pivot Designer article for more information on pivot tables.
This report only uses data stored on the BIE Assessment Data Mart table. Any data not collected by the Assessment Data Mart is not included.
 Assessment Report Editor
Read - Select and view Assessment Report linksWrite - Save and share Assessment Report links.Add - View all shared Assessment Report links.Delete - Delete shared Assessment Report links.
Users must also have tool rights to the Pivot Designer tool. Recipients of a shared URL link must have at least Read rights to Assessment Report and Pivot Designer to follow and view a link that was shared with them. For more information about Tool Rights and how they function, see the Tool Rights article.
Assessment Report Editor
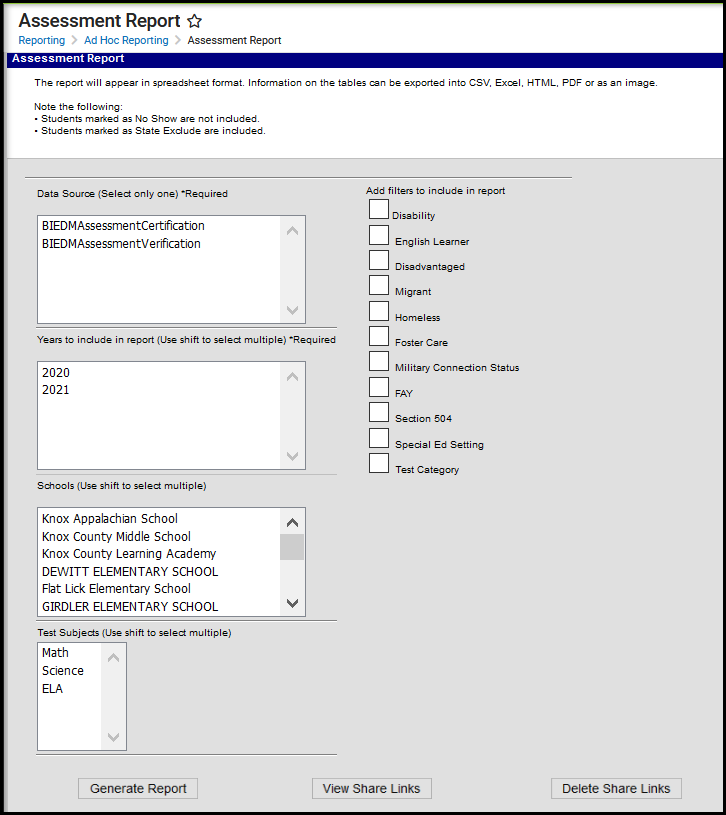
Before generating the Assessment Report, review and select all data elements and filters the report should include from the report editor. Selections made here determine which of the BIE Assessment Data Mart's data tables the report uses and provides additional filtering options to cross reference and analyze the student data. If the report has already been generated, and important data or filtering selections were missed, close the window where the report generated and run a new report after all desired selections are made.
Report Logic
Assessment Report Editor Field Descriptions
| Field | Description |
|---|---|
| Data Source *Required | Identifies the data table the report will use to generate results. Only one Data Source can be selected. BIEDMAssessmentVerification
|
| Years to include in report *Required | Identifies all the school years the report should include. When the report generates, years will display as an expandable dimension and can be filtered to a specific year(s). Each year requires it's own BIE Assessment Data Mart. If a data mart does not exist for a year a report can not be generated. |
| Schools | Identifies which schools the report should include. When the report generates, each selected school will display as an expandable dimension. Filtering is available to include/exclude specific schools when viewing the report. |
| Test Subjects | Identifies which assessment test subjects to include in the report. When the report generates, each Test Subject selected will display as an expandable dimension. Filtering is available to include/exclude specific test subjects when viewing the report. |
| Add filters to include in report | Select any additional filters you would like to use when viewing the report. Filters selected here are become an available filter option in the report but are not automatically applied. |
| Generate Report | When generated, the Assessment Report opens in Pivot Designer in a new window. |
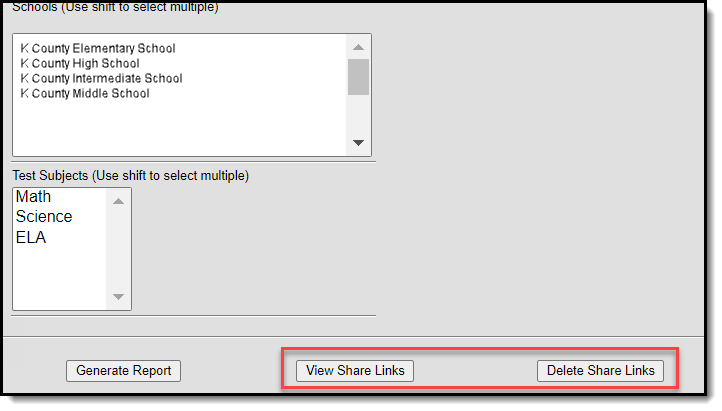
| View Share Links | Populates a list of all shared links in CSV format. |
| Delete Share Links | Deletes all shared links. Selecting Delete Share Links will override the URL's expiration date. Expiration dates are entered at the time the URL was generated and automatically delete on the specified date and time. |
Generate the Report
- Select one Data Source.
- Select a year from the Years to Include list. Use the CTRL or SHIFT keys to make multiple selections.
- Select a school from the Schools list. Use the CTRL or SHIFT keys to make multiple selections.
- Select a Test Subject. Use the CTRL or SHIFT keys to make multiple selections.
- Select a filter or multiple filters to add to the report (optional).
- Select Generate Report. Report opens in a new window on a pivot table.
 Grid View of Generated Assessment Report
Understand the Assessment Report
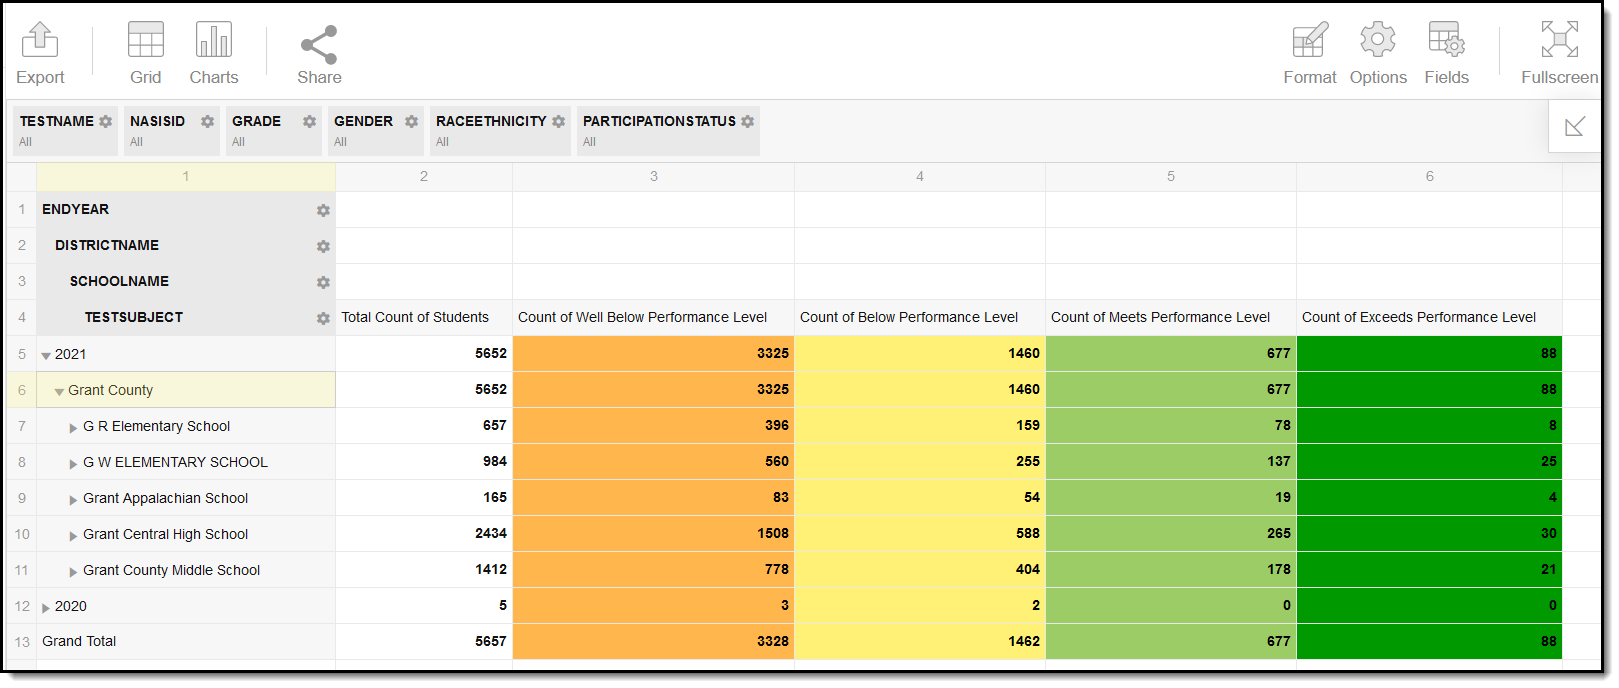
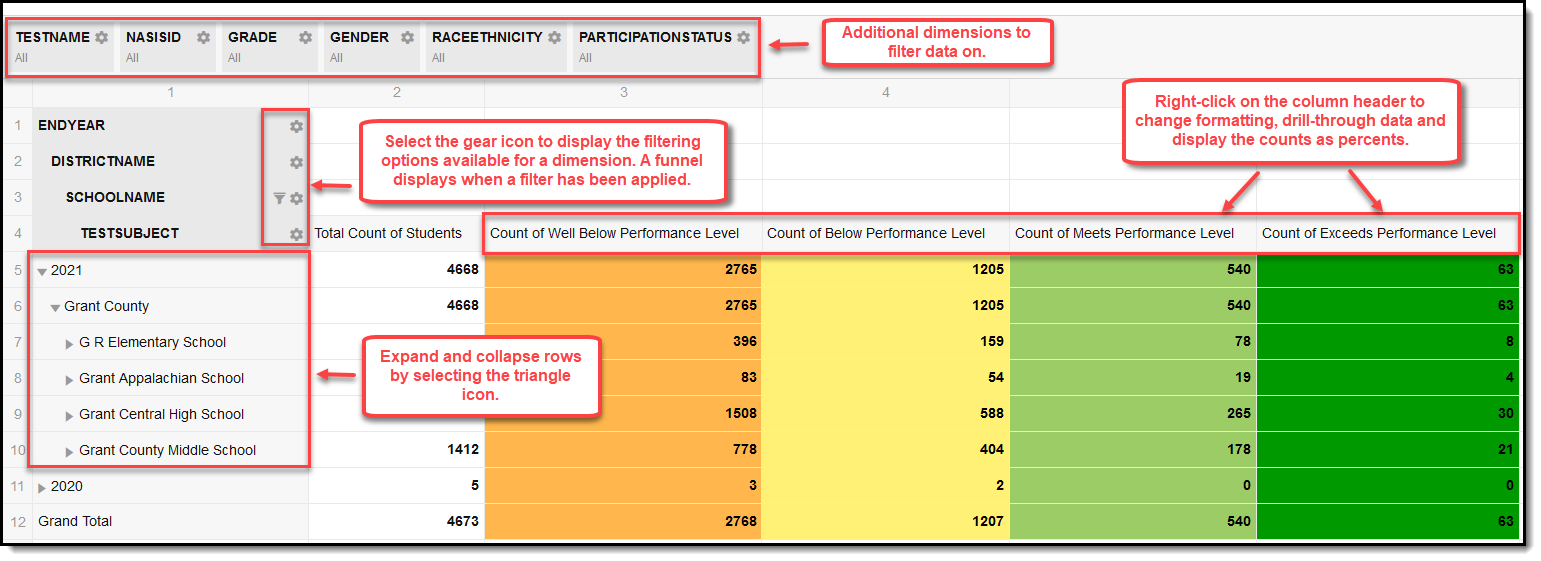
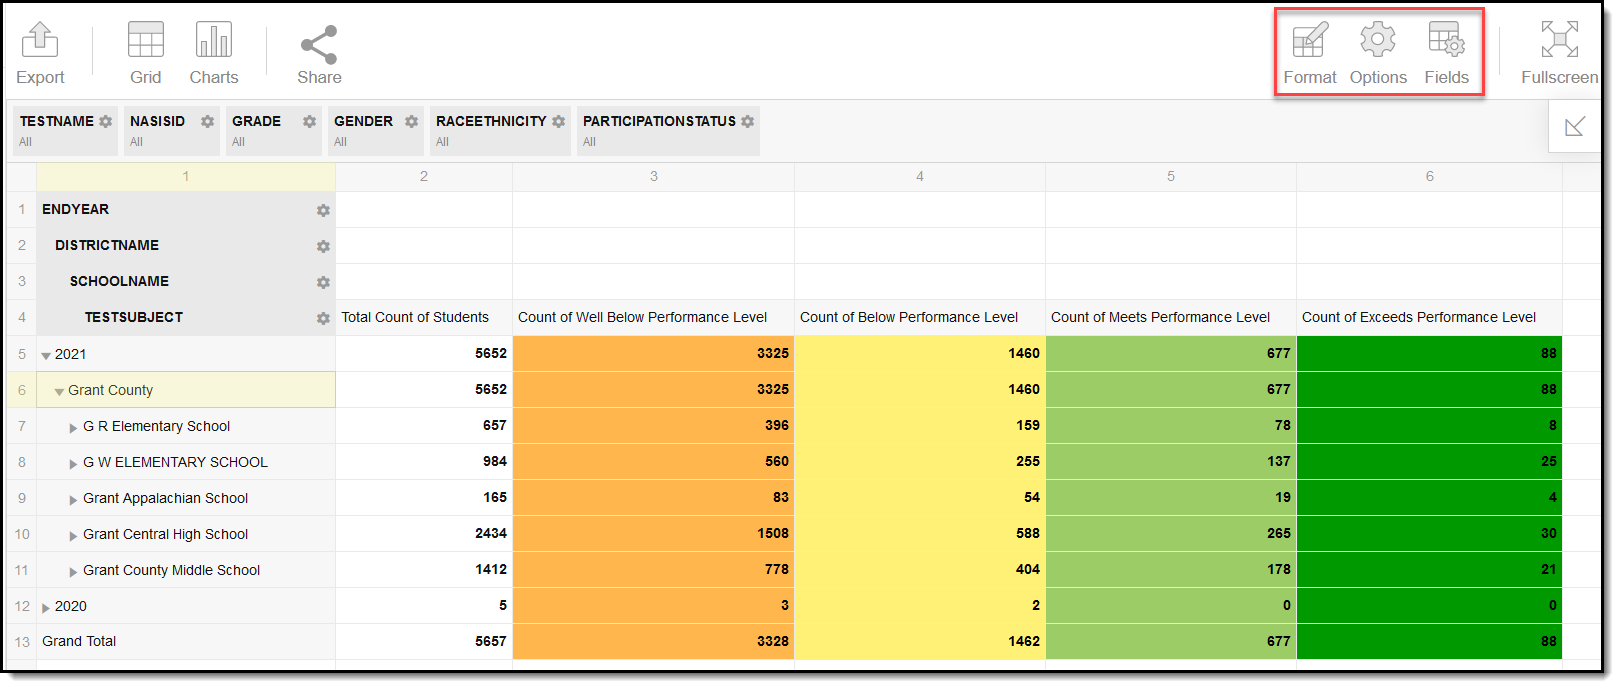
The Assessment Analysis Report opens in Pivot Designer where pivot table functionality can be used to sort, group, summarize, and count student assessment records pulled from the BIE Assessment Data Mart's data tables. By default, the report generates in grid view using default formats. Reporting dimensions (School Year, District, School, Test Subject) display in the first column along the left side of the grid. Each dimension can be expanded and filtered on to narrow down, manipulate and focus on specific data points. Additional dimensions, or labels, display in a row along the top of the report and include any previously selected filters from the report editor.
 Assessment Report in Pivot Designer
Filtering
Filtering options are available and provide a way for a user to cross-reference and analyze specific data points. Users may find filtering necessary to compare yearly totals, understand the impacts demographics play in overall counts, and simply reduce the amount of data being displayed.
When a filter is applied, excluded data is hidden until the filter is either removed, or the report is closed. Filters are not automatically applied when the report generates and are not saved when the report is closed.
More information on filtering can be found in the Pivot Designer article under the section Understand Pivots.
Add a Filter
 Filtering a Dimension
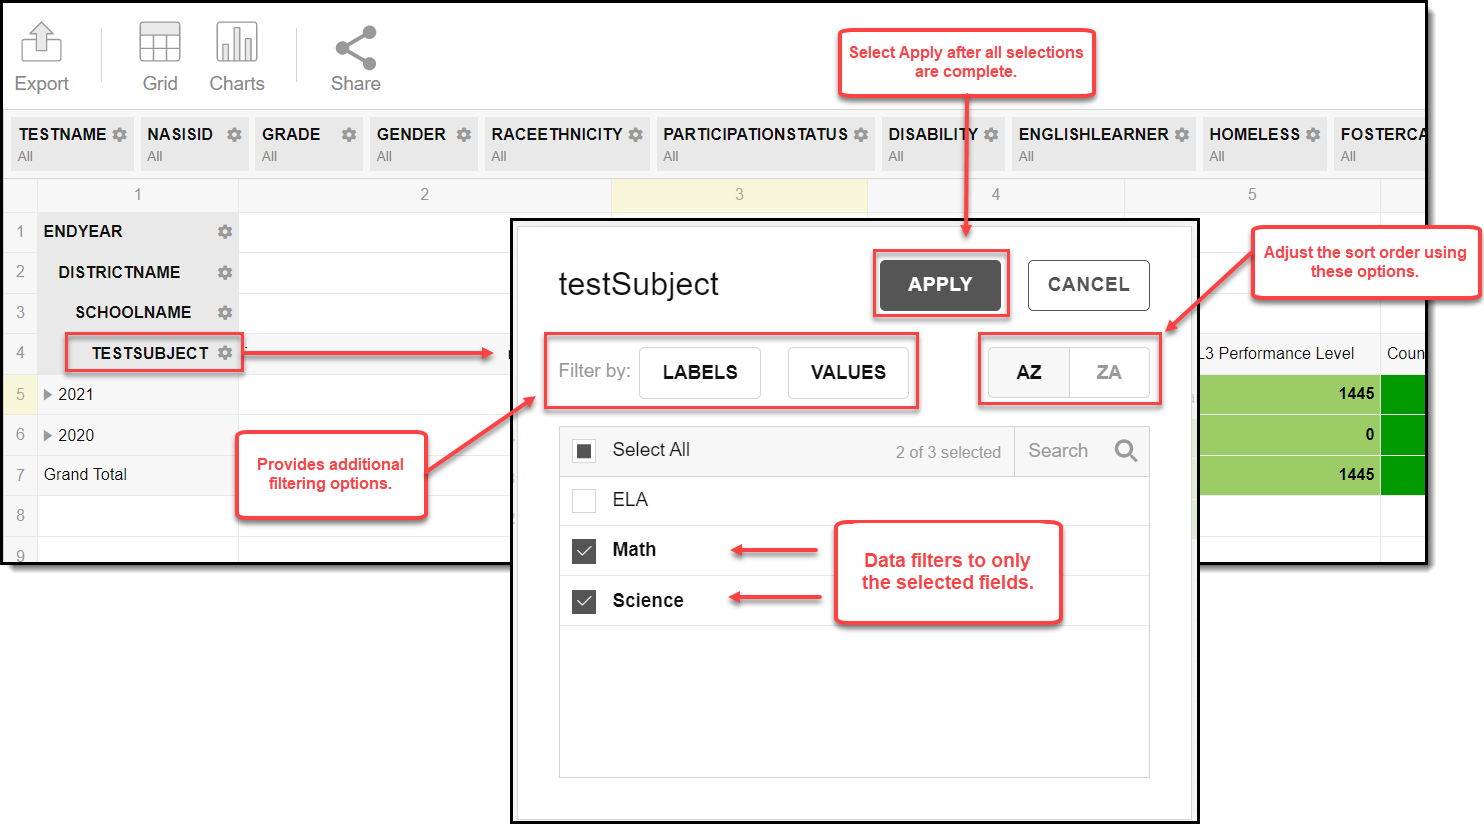
- Select the gear icon to the right of the dimension header.
- Remove the check mark from the fields the filter should not include.
- Select Apply. All report counts will filter to only include student's who meet the criteria of the filter.
Remove a Filter
- Select the gear icon associated to the dimension you wish to remove the filter from.
- Select the "Select All" check box to mass select all boxes. The filter is removed when all boxes are selected.
- Select Apply.
Assessment Report Editor Filter Options
Before generating the report, additional filters are available for selection from the Assessment Report editor. Filters selected here are optional and are not required for the report to generate.
When the report is generated, any filters selected here will display along the top of the report as a 'Label'. A user must select the gear icon to the right of the label's name to apply a filter.
 Assessment Report Editor Filters
Add a Report Editor Filter
The following steps only apply to the additional filter options available for selection in the report editor. Selections must be made prior to generating the report. Additional filter options can not be added once the report has generated. If a filter is missed, close the window the report generated in and start over.
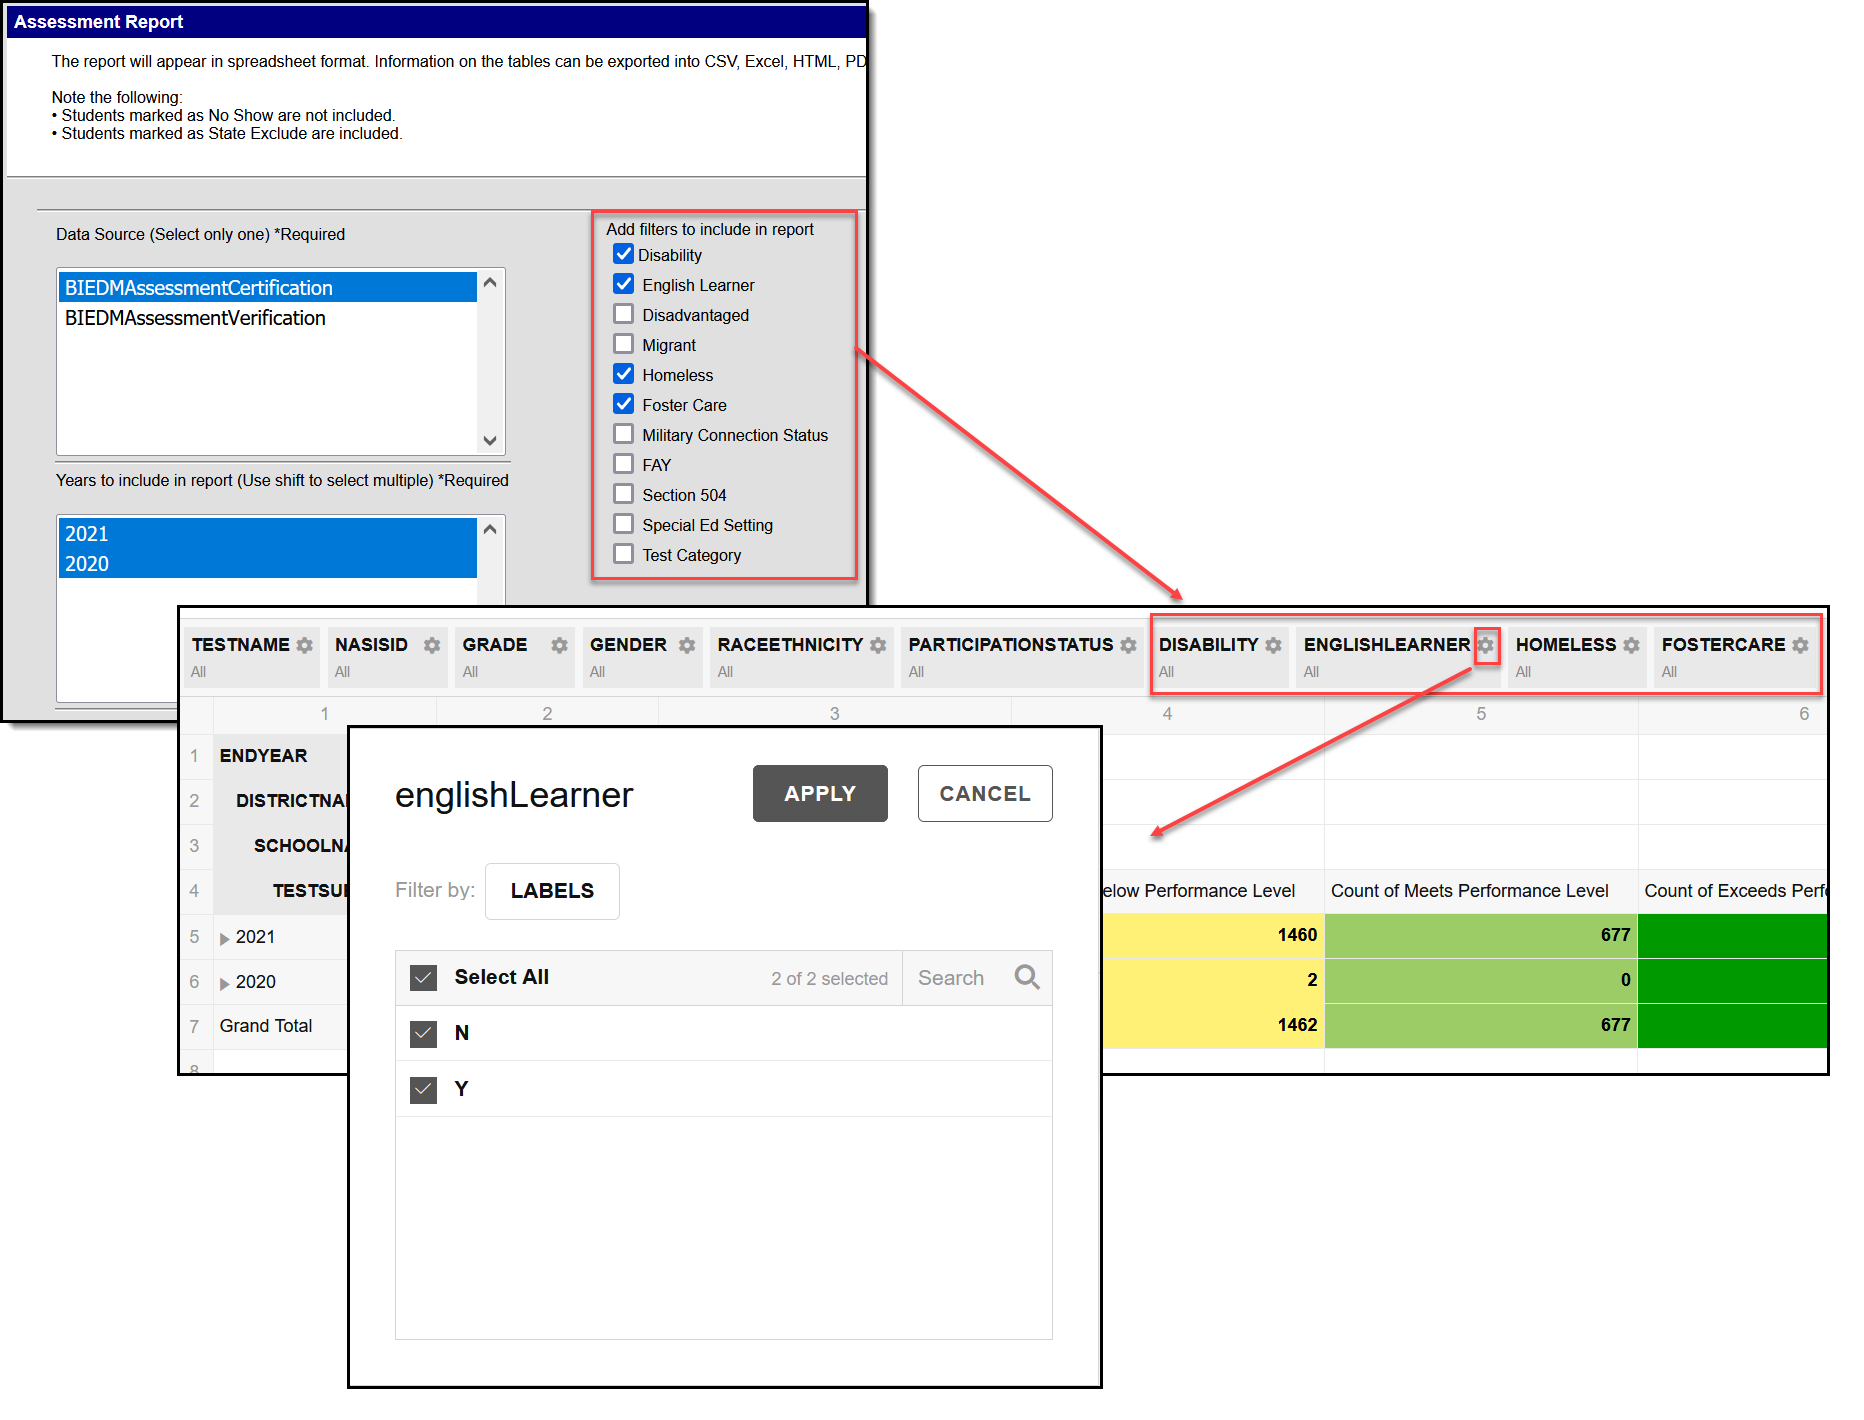
- From the Assessment Report editor screen, select all additional filters you wish to include. Once all data and filter selections have been made, select Generate Report.
- After the report has generated, select the gear icon for the label you wish to apply a filter to. A pop-up window displays with available filtering options.
- 'All' displays below the name of a label when a filter is not applied. By default, filters are not applied when the report is generated.
- Remove the check mark from the fields you do not want the filter to include.
- In this example, by removing the selection from the 'N' (No) checkbox, the report will filter to only include EL student counts.
- Select Apply. Report counts filter to only include student's who meet the criteria of the filter.
Note - If applying a filter to one of the report's default labels, ignore step one. Default labels can not be selected/unselected from the report editor and automatically display when the report generates.
Default labels include: TestName, NASISID, Grade, Gender, RaceEthnicity, ParticipationStatus.
Remove a Filter
- Select the label you wish to remove the filter from.
- Select the "Select All" check box to select every box. All boxes must be selected to remove filtering.
- Select Apply.
 Remove a Filter
Note - This process can also be followed to remove filters applied to any of the report's default labels. Default labels include: TestName, NASISID, Grade, Gender, RaceEthnicity, ParticipationStatus.
Charts and Graphs
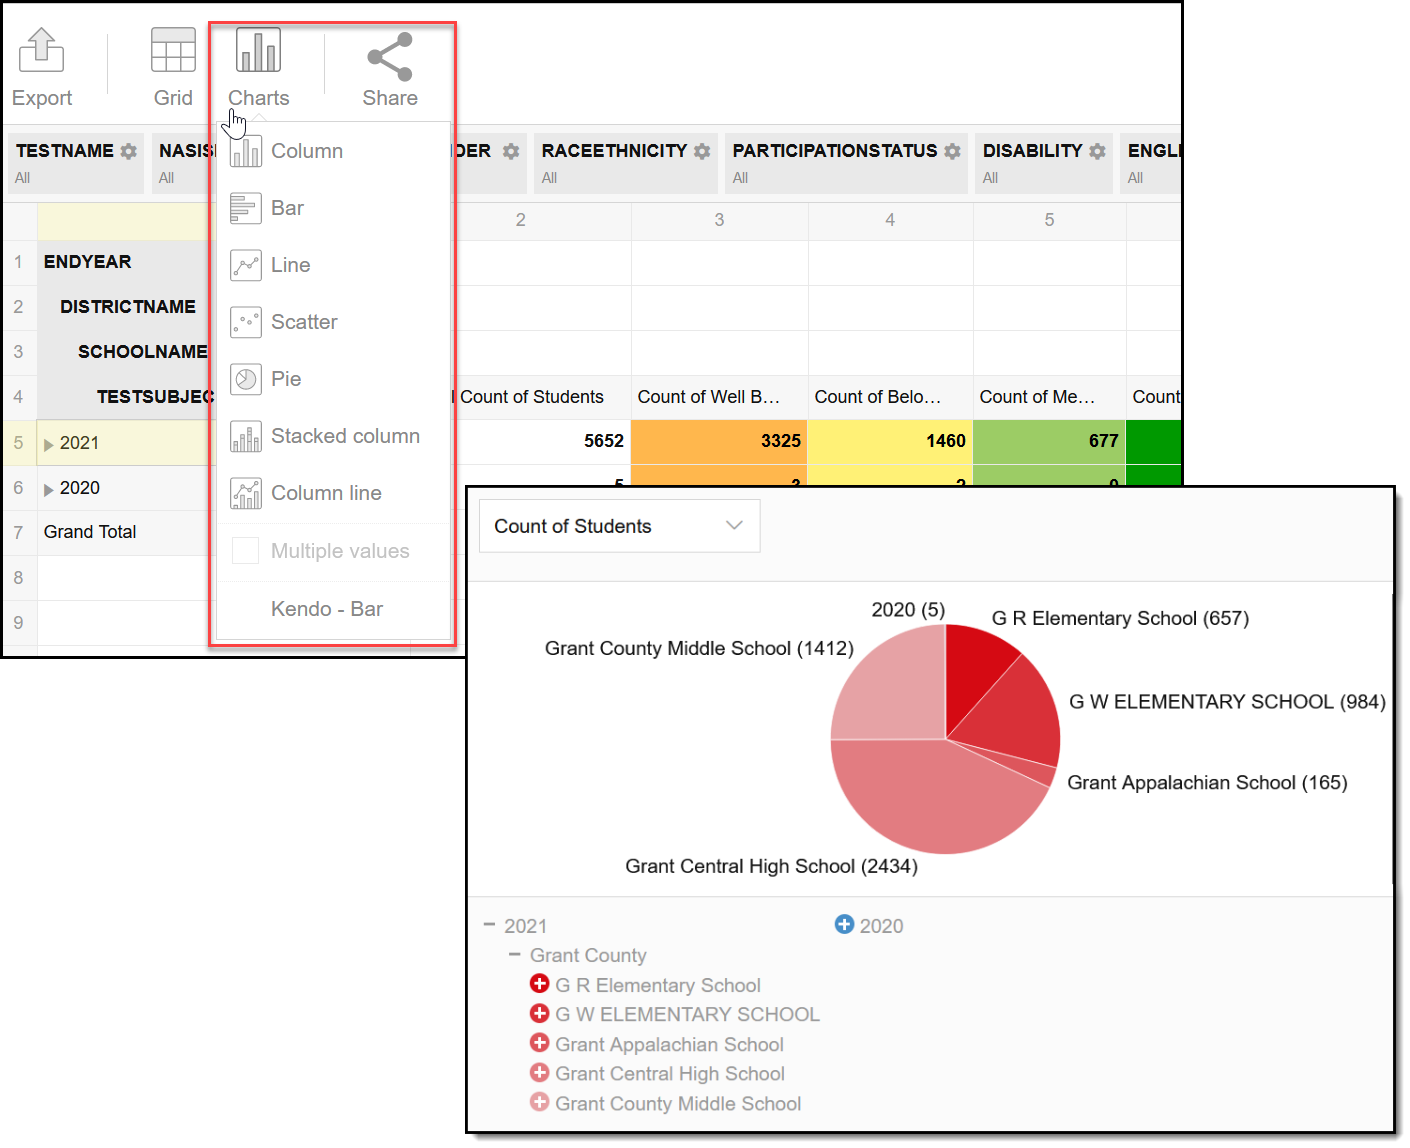
Charts and graphs provide a way for users to analyze and interpret the data by viewing it in different formats. To view the information in a chart, click on the Charts icon and select from the options listed. Additional information on charts and graphs can be found in the Create Charts from Pivot Data section of the Pivot Designer article.
Charts and graphs respect any filtering that has been applied to the report.
Select Grid to return to the report's default format.
 Example of Pie Chart
Format and Layout Options
Formatting and layout options are available to customize how the data in the report displays. Default selections are applied when the report is first generated. Additional information about Format, Options and Fields can be found in the Format and Layout Options section of the Pivot Designer article.
 Format and Layout Options

Fields
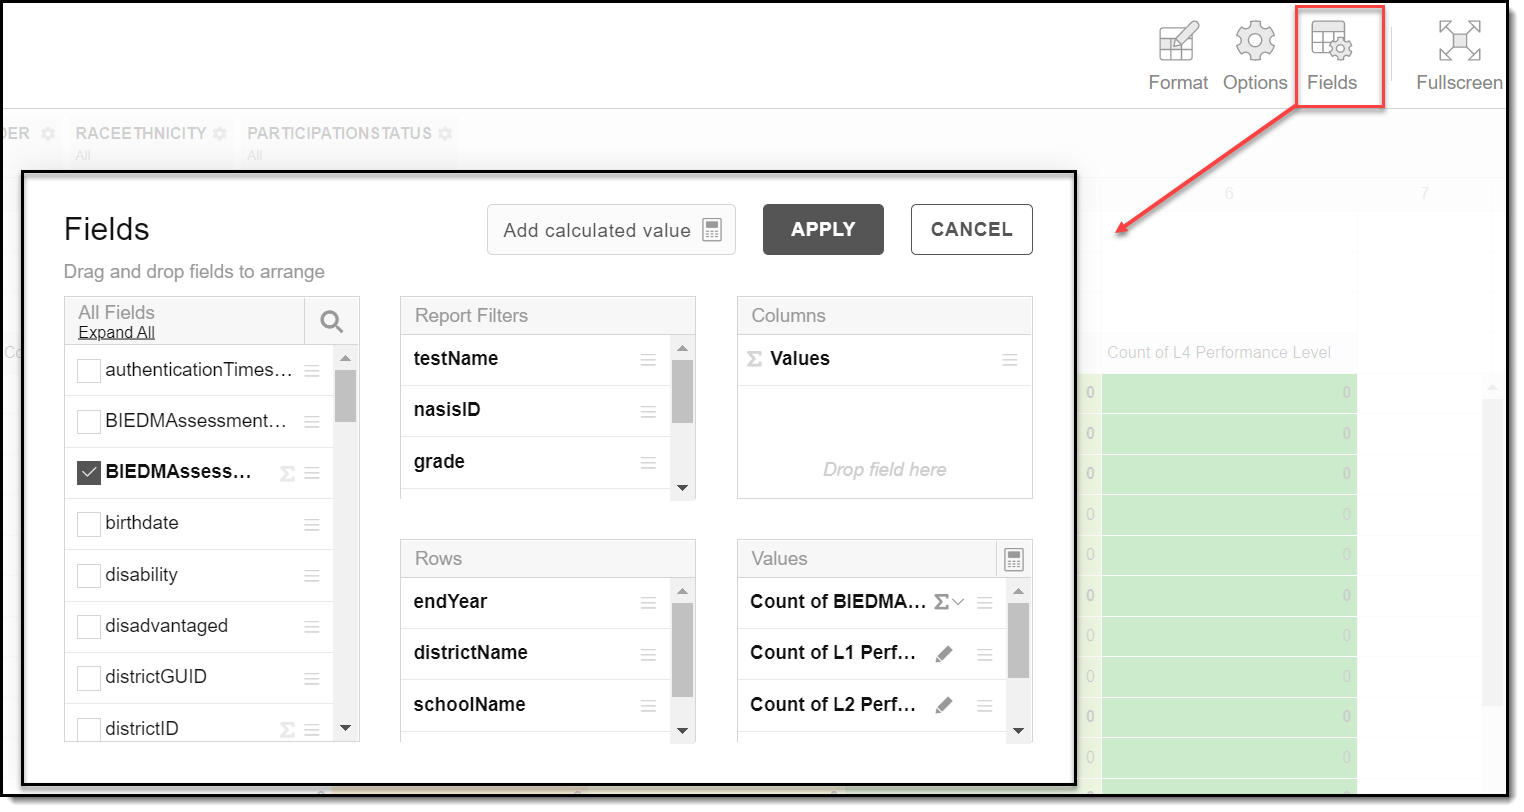
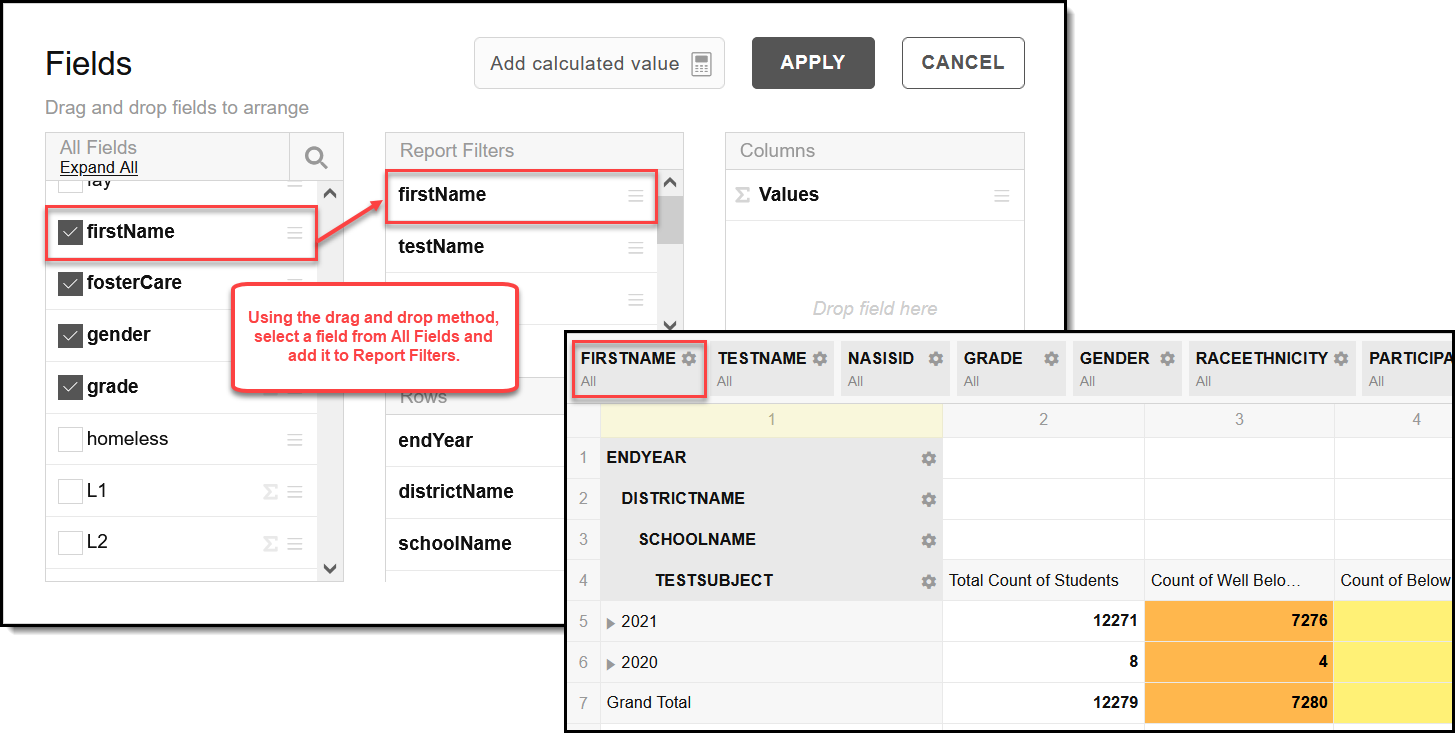
Fields allow you to manipulate the order of how data displays in the report. Using the drag and drop method, users have control over the placement of all reported fields.
 Fields
Values
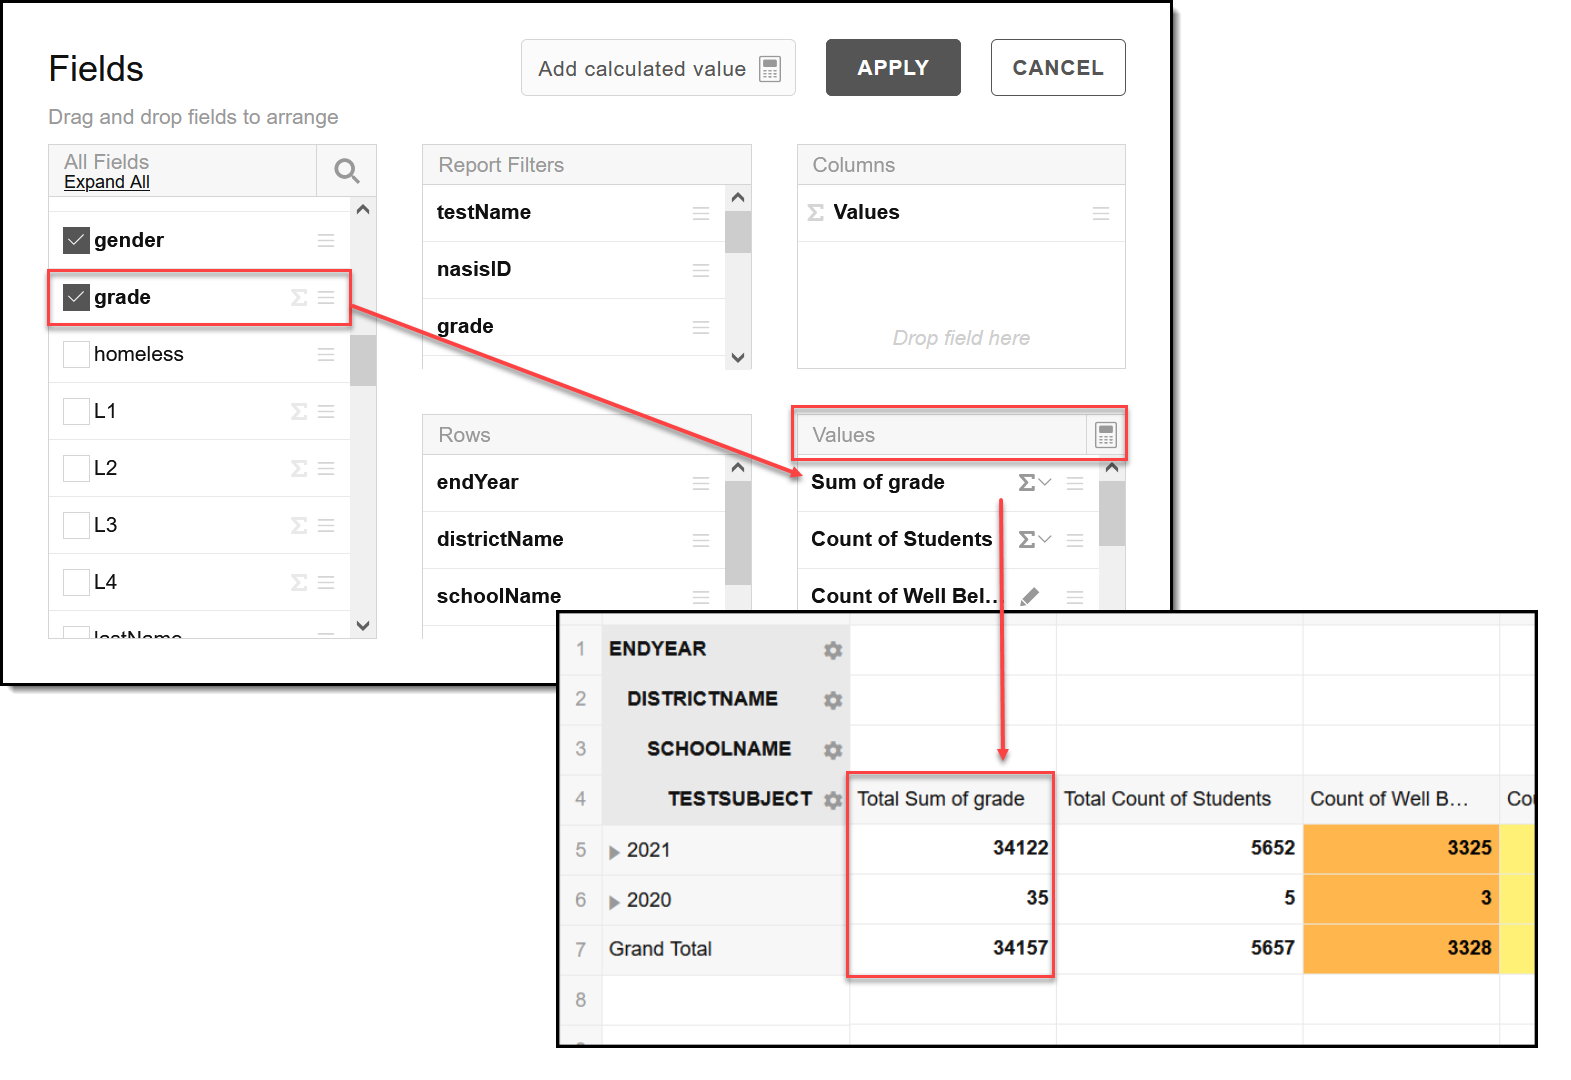
To get a count of a data set, drag and drop the selected field(s) into Values and select Apply. A new column for the field will display in the report with student subtotals. To remove a field, drag and drop the field back to the All Fields list.
 Editing Field Values
Rows and Columns
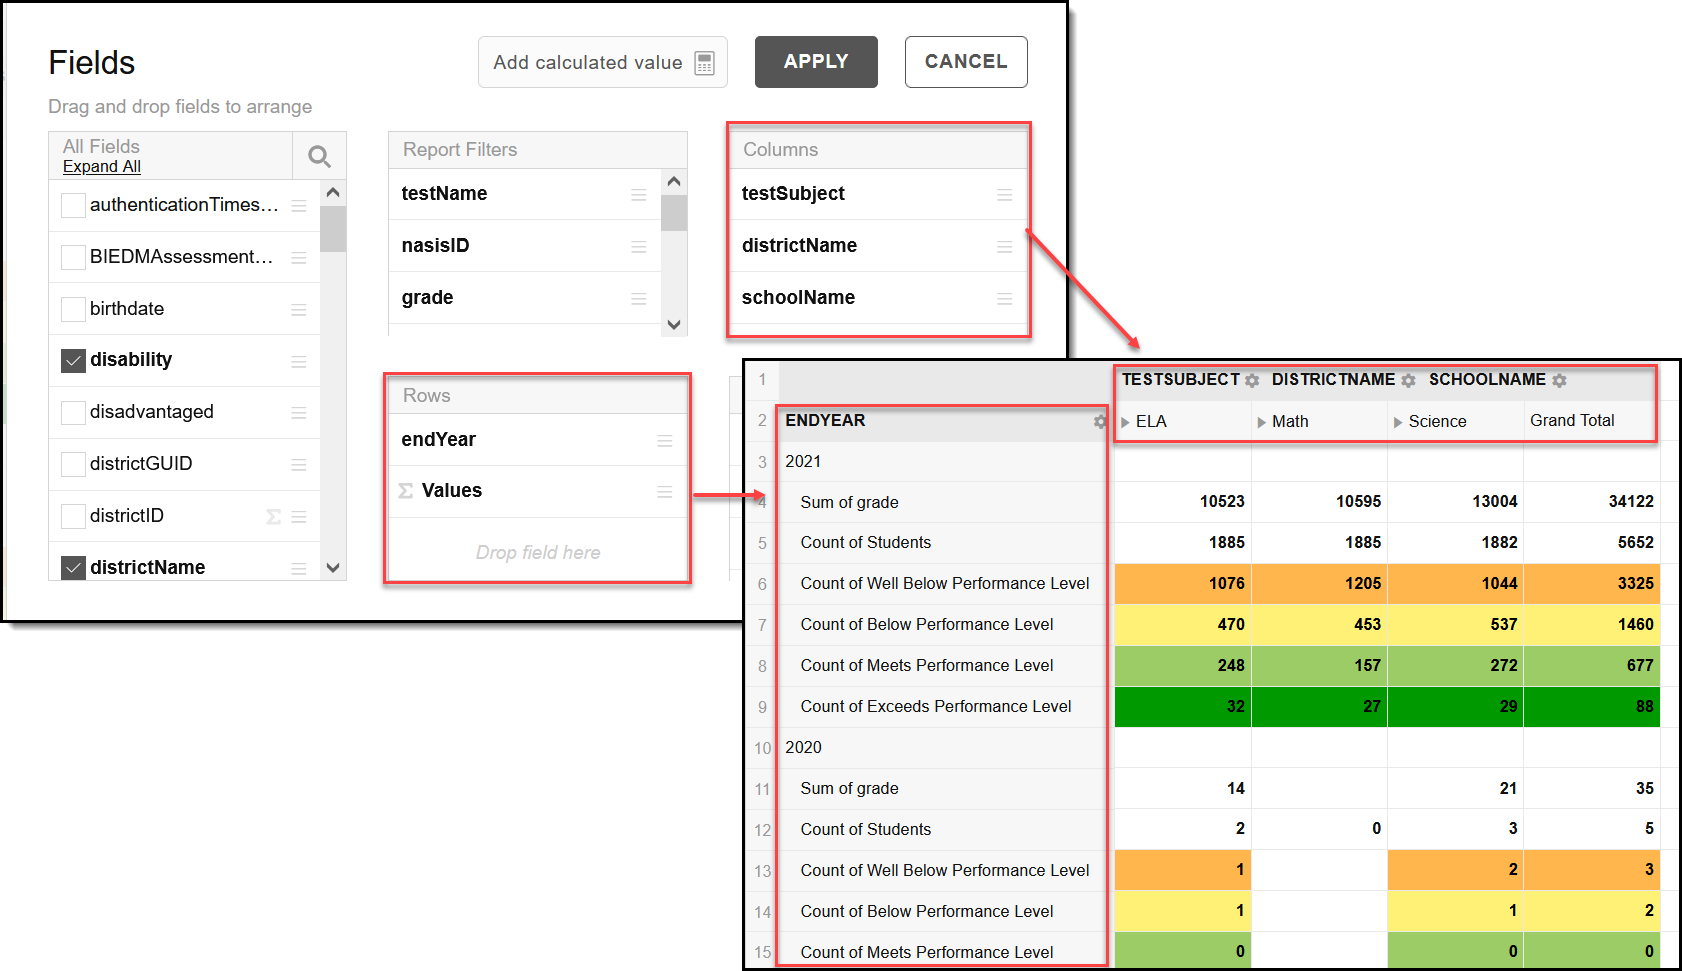
Using drag and drop, users can add and reorder fields to display the data in different ways when viewing the report. To remove a field, drag and drop the field back to the All Fields list.
 Editing Rows and Columns
Report Filters
Using drag and drop, users can add fields to Report Filters as additional filtering options to use in the report. Fields added to Report Filters display as a label at the top of the report. To remove a field, drag and drop the field back to the All Fields list.
Refer to the Filtering section of this article on how to apply a filter.
 Editing Report Filters
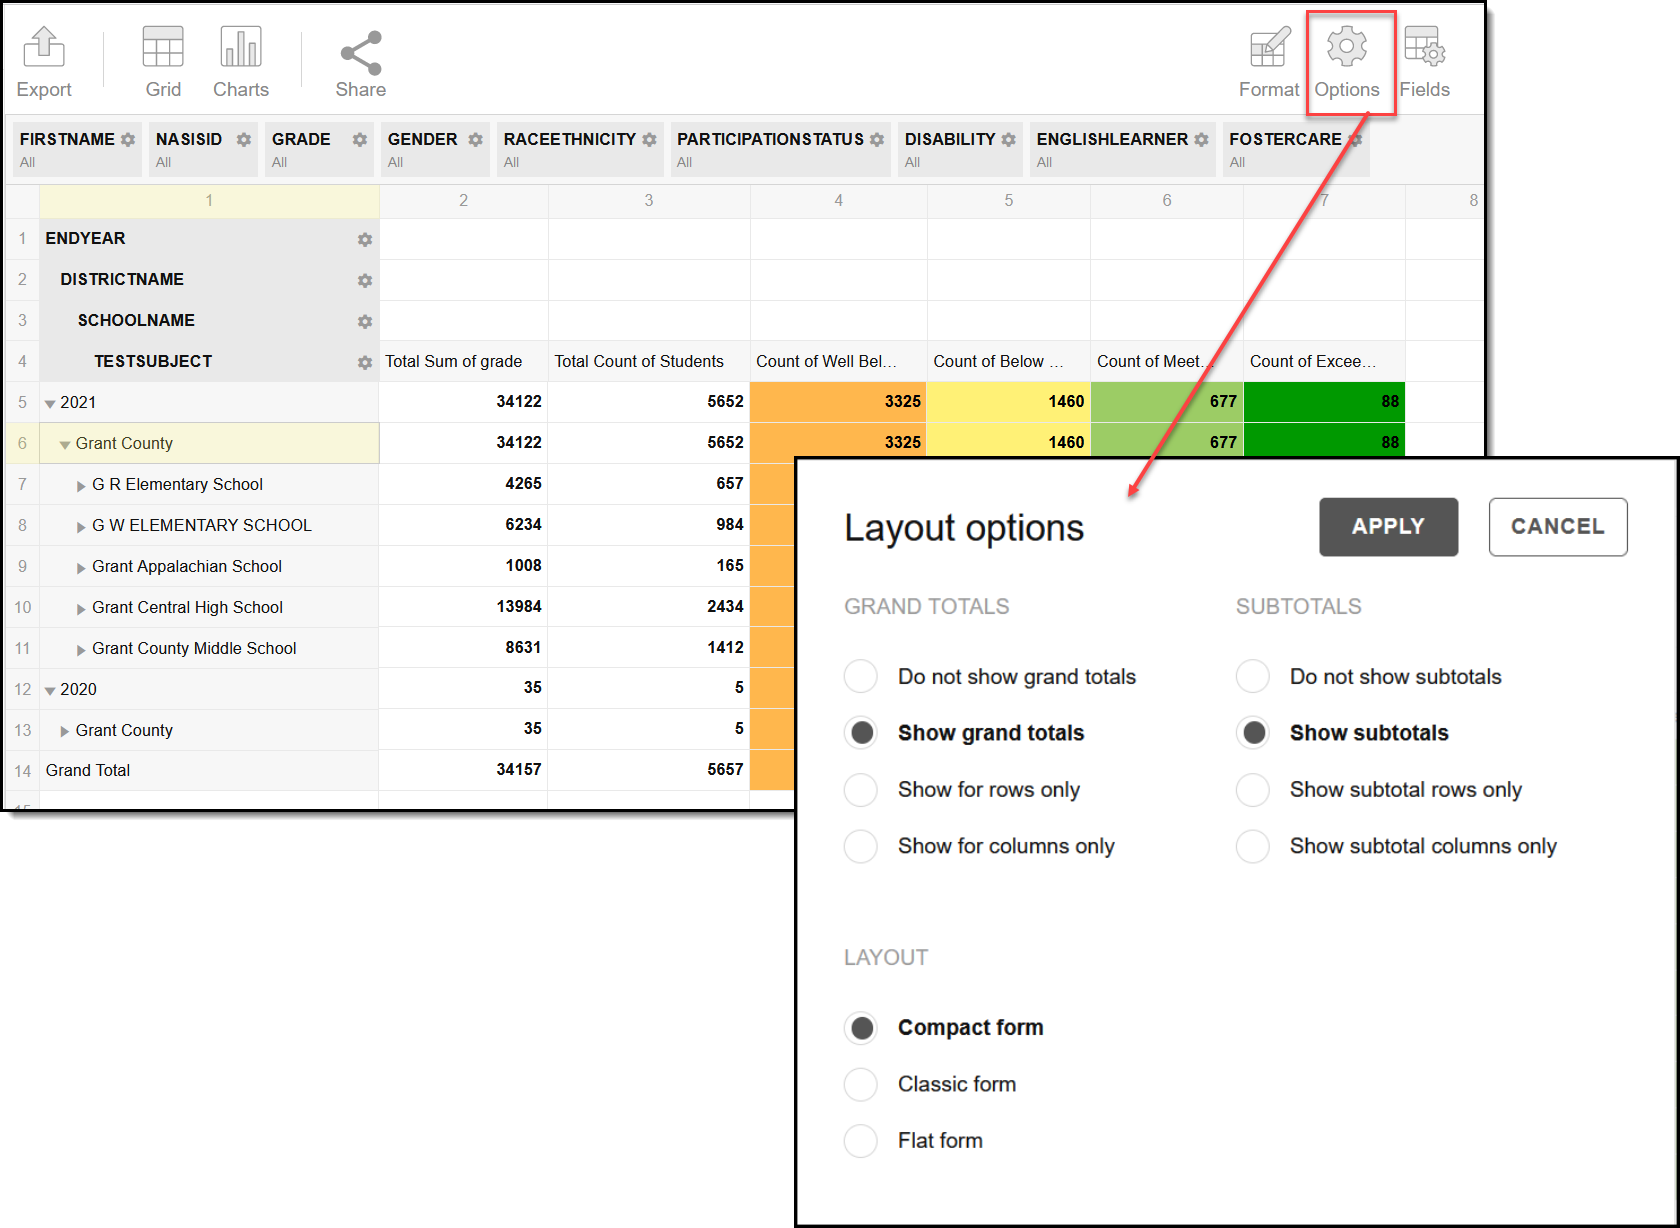
Options
Options allows a user to adjust the layout of the report including the display of subtotals and grand totals. More information about Options can be found in the Format and Layout Options section of the Pivot Designer article.
 Layout Options
Format
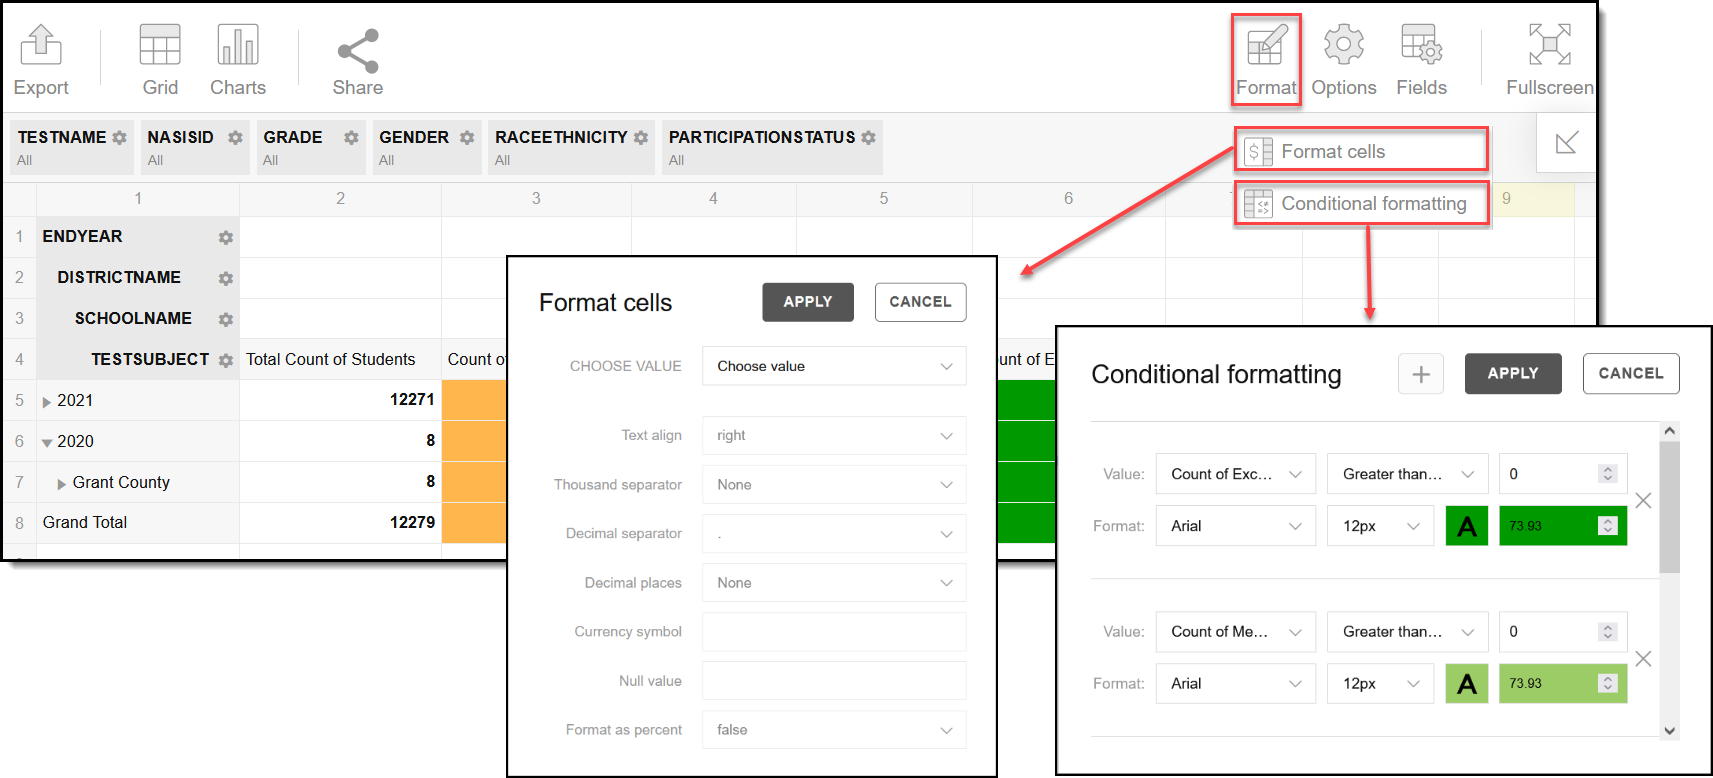
Format options allow you to modify how cells represent data within the pivot table.
To access format options, click the Format button and select one of the following options:
- Format cells - This editor allows you to control how text within the cell is aligned, what value is reported in the cells, how decimals are used, the current symbol used, any default null value you want the table to display, and whether or not you want data displayed as a percentage.
- Conditional formatting - This editor allows you to set cell value thresholds as to whether or not the data is reported for each cell (less than or greater than a certain value) as well as modify the cell text size and font.
Refer to the Format Options and Layout section of the Pivot Designer article for additional information.
 Format Options
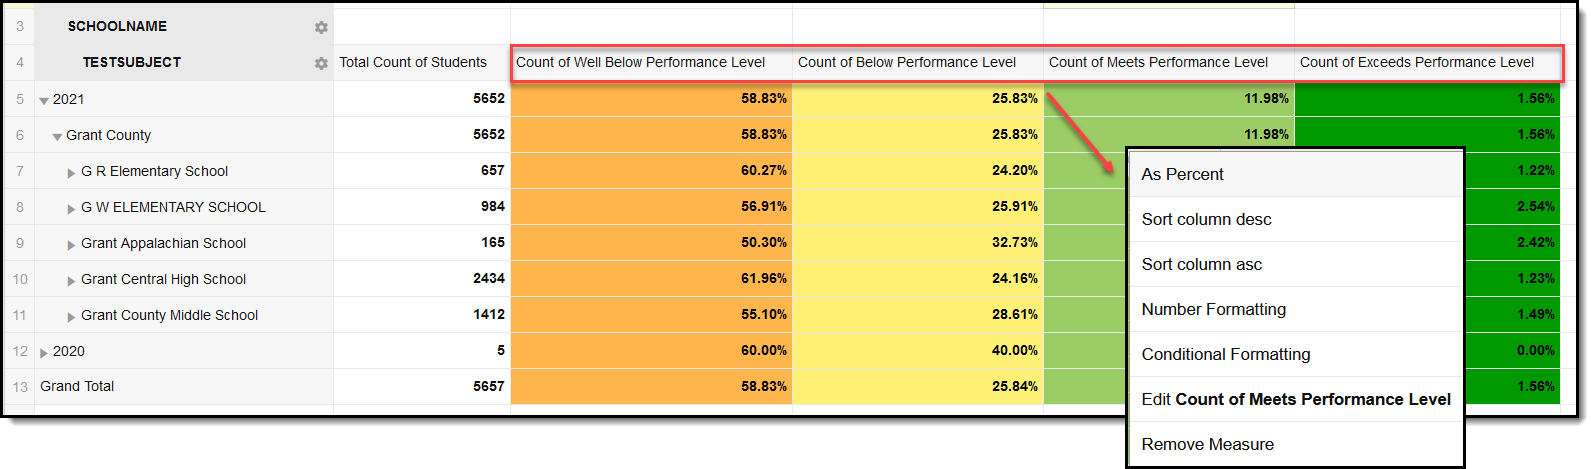
Other Formatting Options
Right-click on any of the column headers to select from a list of additional formatting options.
To change the reported values from displaying as a Count to display as a Percent, right-click on any of the column headers and select "As Percent".
 Formatting Options - Right-click on Column Header
Export and Share
Users may choose to Export the report to a number of external formats, or Share the report's URL with another Campus user. More information about Export and Share can be found in the Export and Share Pivots section of the Pivot Designer article.
Export
When a report is exported to another format such as PDF, CSV or HTML, the reported data elements are no longer linked to Campus' data tables. At this point, exported data is static and only represents the state of the data at the time the report was generated. Using the Export option, reported findings can be added to non-Campus tools for purposes of outside reporting or sharing with stakeholders who may not otherwise have access to it. Export can be used with any of the Charts formats.
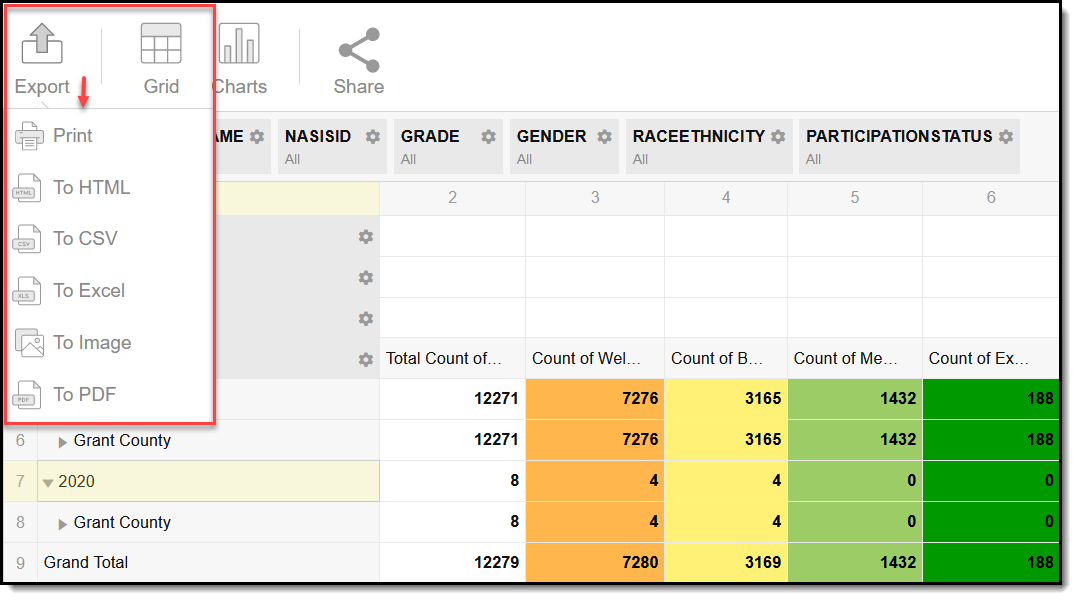 Export Assessment Report
Share
Use the Share option to share a link of the current view of the Assessment Report with another user. The recipient of the URL must (minimally) have Read rights to the Assessment Report and Pivot Designer tool to view what was shared. Access to the report using a shared link will expire based on the date and time entered in the Share Link Expiration Date fields.
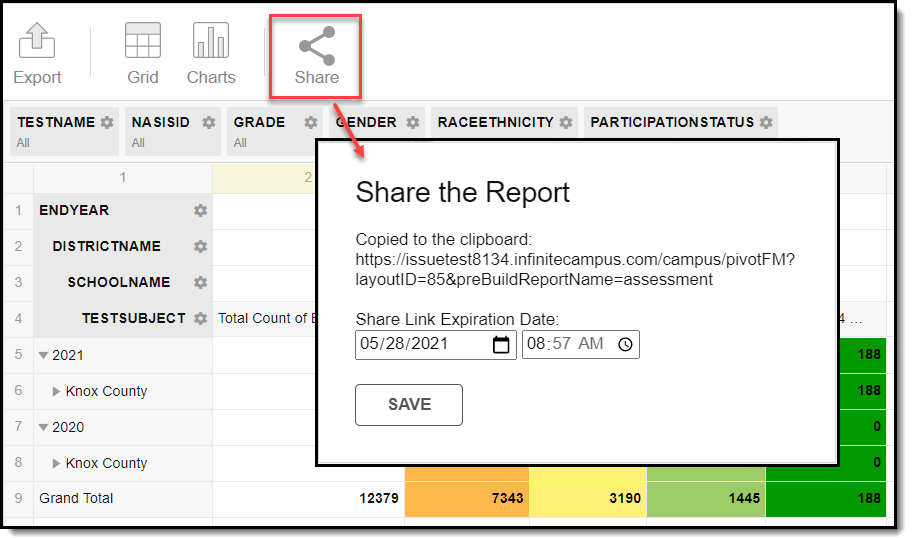 Share Assessment Report
View Share Links
From the Assessment Report editor, users who have been assigned (W)rite tool rights to the report can view a CSV list of only the links they have created by selecting the View Share Links button. If a user is also assigned (A)dd and (D)elete tool rights they will be able to see all shared links created by any user in a CSV list.
Delete Share Links
Users who have (D)elete tool rights or who hold the Student Information System Product Security role can delete all shared links by selecting the Delete Share Links button (all links will be deleted if Delete Share Links is selected).