This tool is available as part of the Campus Learning premium offering and requires the Enhanced Curriculum tool right. Visit What is Campus Learning? to learn more.
Tool Search: Grade Book, Teaching Center, Progress Monitor
The Score Analysis tool is available through the Grade Book and Teaching Center. It allows teachers to view a distribution of student scores on an assignment and visually break down how each student scored.
Access Score Analysis
| Single Assignment | All Assignments in a Section |
|
|
 . Access the scoring editor by clicking Score when viewing an assignment or clicking the assignment icon in the Teaching Center and then a (non-submission) assignment .
Single Assignment
Score analysis for a single assignment displays a score distribution graph representing all scores for the assignment. The percentages on this graph indicate the number of students who received that score. For example, the image below shows that about half of the students got a B- or higher on the assignment. Hover over each section of the graph to see the score it represents and how many students received that score.
Below the distribution, the breakdown section lists each student who has received a score, displaying score information and an individual graph.
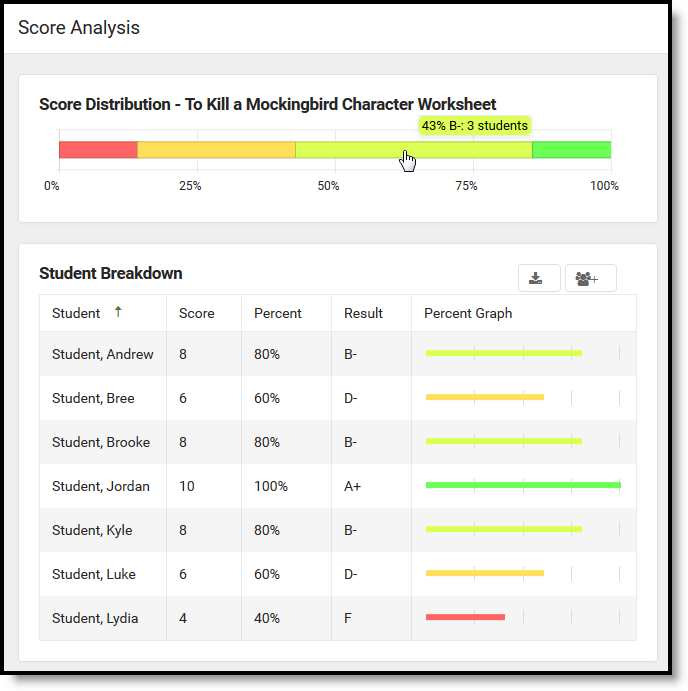
Score Analysis provides a distribution of all scored students and a breakdown showing details for each score.
Filter the student breakdown by clicking sections of the distribution graph. Hold SHIFT or CRTL to select multiple scores to include in the breakdown.
Click  to export the breakdown, with present filters, to Excel. Click
 ![]() to create a Student Group of the students currently included in the breakdown.
to create a Student Group of the students currently included in the breakdown.
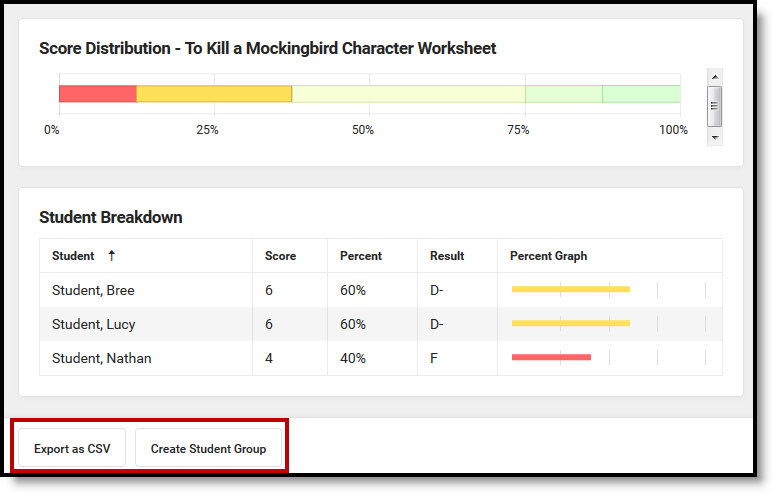
Click one score or use SHIFT and CTRL keys to filter the breakdown.
In this example, I want to create a student group of the students who received 60% or lower on the assignment so I can give them a followup assignment. Hold the CTRL key while clicking the lowest two scores on the distribution and then click Create Student Group and enter a name. The student group is then available to modify in the student group and to select on assignments.
Multiple Assignments
Score analysis from the Settings menu of the Grade Book starts with just distributions of all assignments in section. Assignments display in order by Due Date, starting with the most recent.
Click on one or more sections in the distributions to view a list of students below.
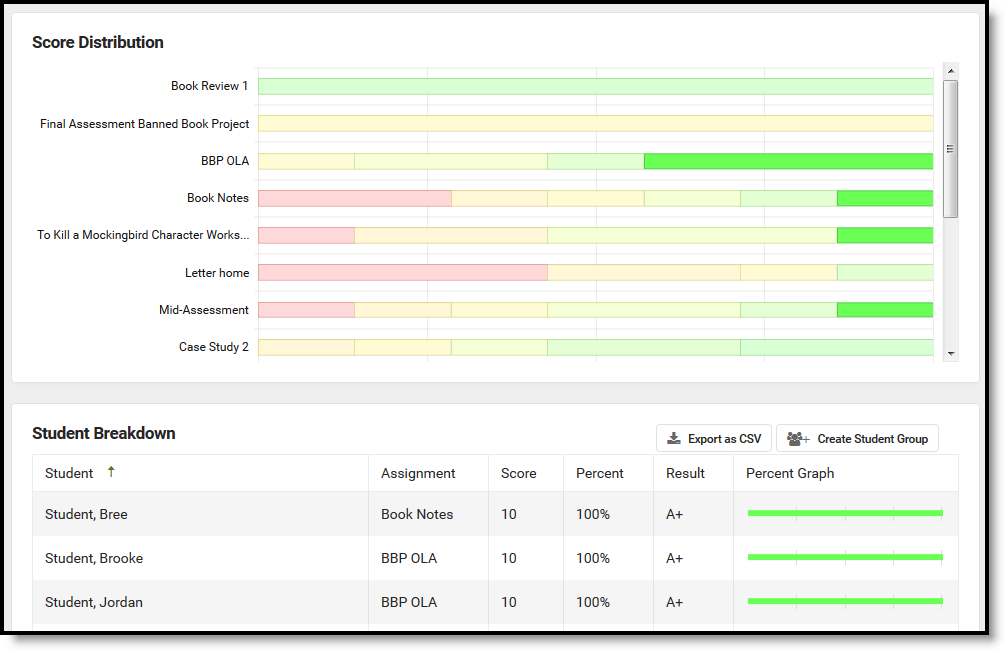
From the Grade Book Settings menu, view the score distributions of multiple assignments.
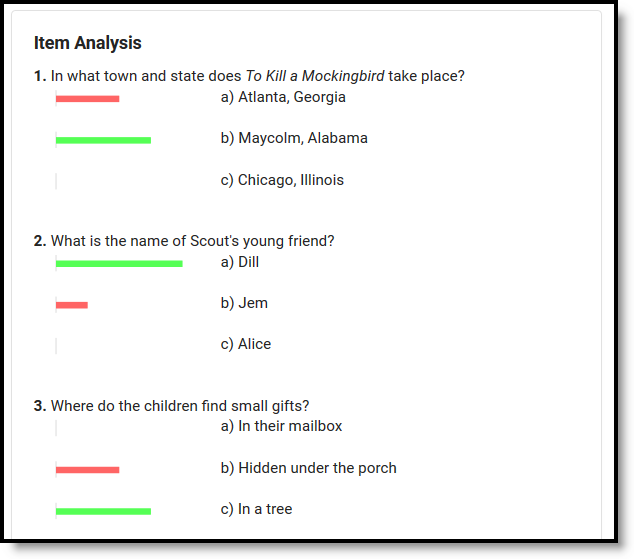
Quizzes
Assignments with Quizzes (formerly Quick Assessments) have an additional Item Analysis section below the Student Breakdown. This item analysis section indicates how students performed on each question, with bar graphs indicating the relative number of students who selected each answer. |
|
Scoring Rubrics
Additional score information displays for assignments evaluated using Scoring Rubrics. See the articles about creating and scoring for more information about scoring rubrics.
Below the score distribution and student breakdown that display in score analysis, the scoring rubric displays. For each grid square, the number of students who met that criteria is shown, over the total number of students who have been scored.
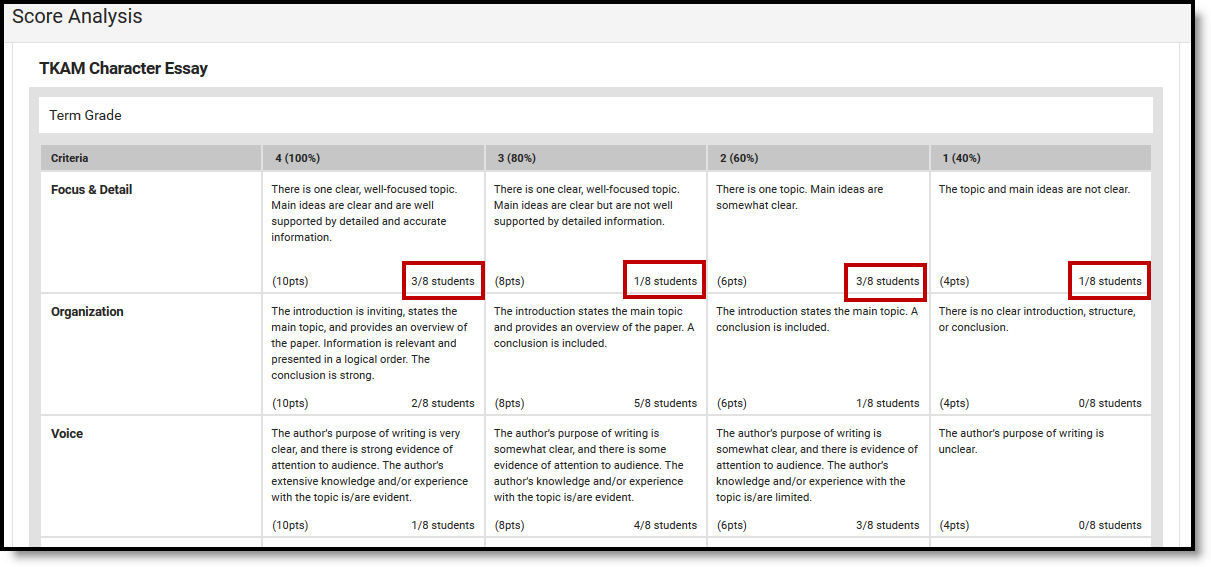
View score analysis for assignments evaluated using scoring rubrics to see the total number of students who met each criteria.
This feature can be helpful in determining where the class is succeeding and struggling. For example, in the image above, half the class got a 60% or lower on the Focus & Detail criteria, so I may want to focus more on topic sentences for our next essay.
Click on a grid square to see a list of students who met that criteria and create a Student Group of those students.
